Daniocell
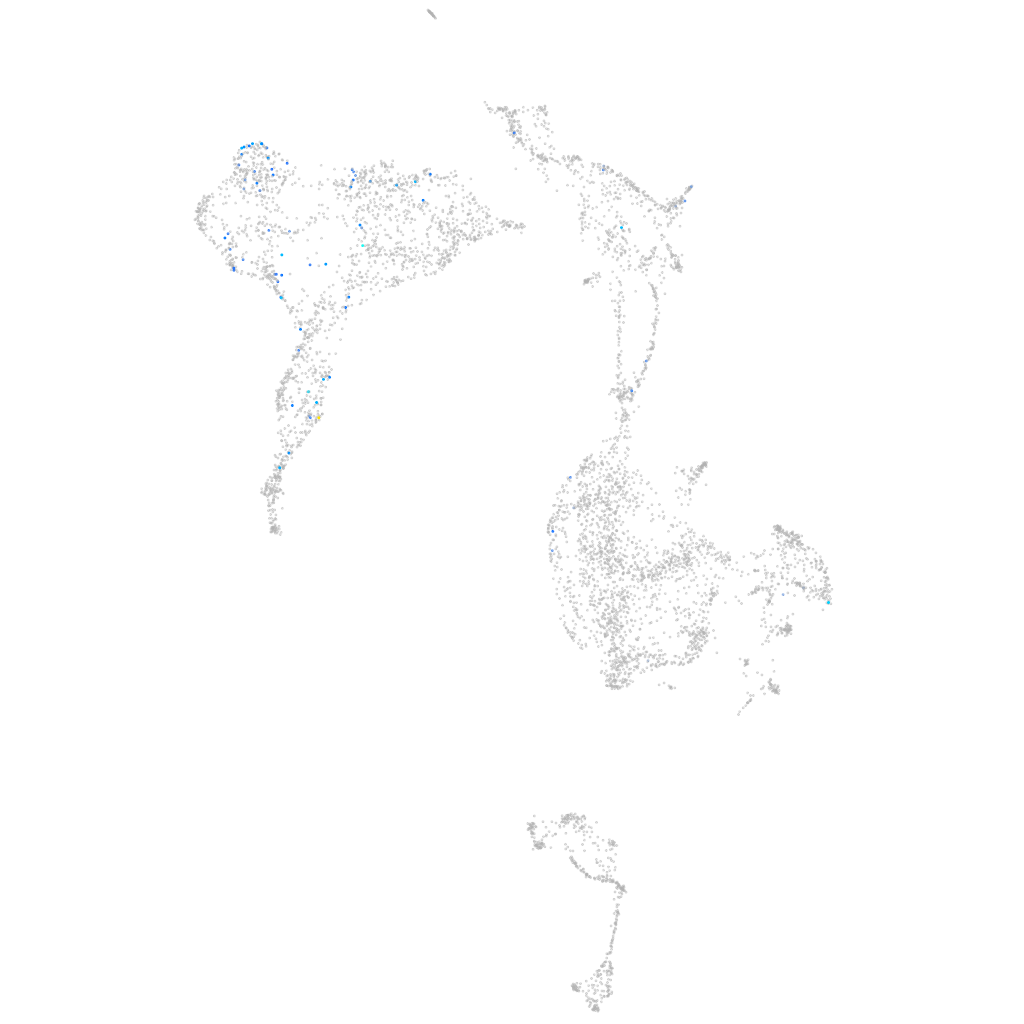
hist1h2a1 (axial mesoderm)
histone cluster 1 H2A family member1
ZFIN
Gene expression UMAP
Display:
Expression
Stage
Other cell groups
all cells
blastomeres
PGCs
endoderm
axial mesoderm
muscle
mural cells /
non-skeletal muscle
mesenchyme
hematopoietic /
vasculature
pronephros
neural
spinal cord / glia
eye
taste / olfactory
otic / lateral line
epidermis
periderm
fin
ionocytes / mucous
pigment cells
Expression by stage/cluster
Correlated gene expression
Positive correlation
Negative correlation
Gene
r
Gene
r
si:ch211-113a14.18
0.198
rpl37
-0.105
si:dkey-108k21.14
0.196
rps10
-0.104
si:ch1073-153i20.4
0.192
zgc:114188
-0.102
si:dkey-7i4.1
0.189
faua
-0.098
si:dkey-108k21.21
0.189
rps27.1
-0.097
si:dkey-261m9.12
0.184
rpl9
-0.094
XLOC-004546
0.177
rps17
-0.093
adm2b
0.177
sparc
-0.092
si:ch73-216m24.3
0.177
rps23
-0.092
si:dkey-11o15.8
0.177
rpl19
-0.091
si:dkey-286j17.4
0.177
rpl26
-0.091
trgv7
0.177
uba52
-0.089
LOC108179735
0.176
rpl14
-0.088
si:ch1073-153i20.5
0.176
rplp0
-0.087
zgc:110425
0.174
rplp1
-0.087
si:dkey-108k21.10
0.172
rpl28
-0.087
si:ch211-113a14.24
0.167
rps2
-0.086
si:dkey-23a13.17
0.164
rpl10a
-0.086
si:ch73-186j5.2
0.160
cnmd
-0.086
si:dkey-88l16.4
0.160
rps3a
-0.085
AL808129.2
0.156
rpl21
-0.085
mki67
0.150
col11a1a
-0.085
si:rp71-7l19.2
0.149
si:dkey-151g10.6
-0.084
zgc:110216
0.145
col2a1a
-0.084
zgc:153405
0.144
rplp2l
-0.083
GRM7
0.141
col9a1b
-0.083
LOC103909443
0.141
col9a3
-0.083
lig1
0.140
col9a2
-0.082
tpx2
0.137
si:ch73-23l24.1
-0.082
ppm1g
0.137
zmp:0000000760
-0.082
LO018605.2
0.137
rpl31
-0.082
ctcf
0.137
rpl39
-0.082
BX908796.3
0.135
rps20
-0.081
plekhs1
0.134
ppib
-0.081
ercc6l
0.133
rps14
-0.081