Daniocell
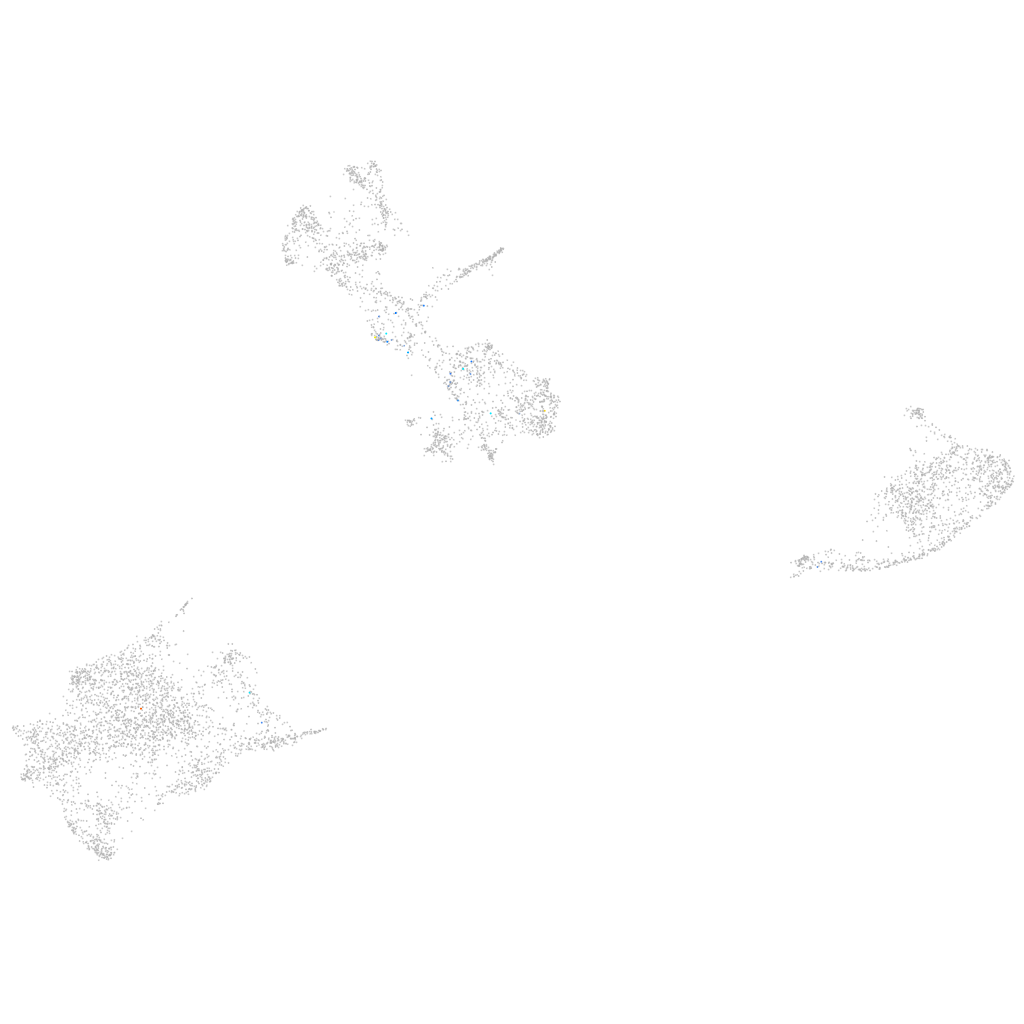
hist1h2a1 (pigment cells)
histone cluster 1 H2A family member1
ZFIN
Gene expression UMAP
Display:
Expression
Stage
Other cell groups
all cells
blastomeres
PGCs
endoderm
axial mesoderm
muscle
mural cells /
non-skeletal muscle
mesenchyme
hematopoietic /
vasculature
pronephros
neural
spinal cord / glia
eye
taste / olfactory
otic / lateral line
epidermis
periderm
fin
ionocytes / mucous
pigment cells
Expression by stage/cluster
Correlated gene expression
Positive correlation
Negative correlation
Gene
r
Gene
r
si:ch1073-159d7.10.1
0.304
actb2
-0.067
si:ch211-198g14.2
0.297
gstp1
-0.042
hist1h2a6
0.244
gch2
-0.041
LOC101886920
0.236
pfn1
-0.039
si:dkey-76k16.5
0.213
marcksl1b
-0.039
LOC110439805
0.213
akr1b1
-0.036
LOC110439392
0.207
COX3
-0.036
pappaa
0.194
slc22a7a
-0.032
pcdh2aa15
0.192
zgc:110339
-0.032
hist1h2a9
0.181
tspan36
-0.031
BX322574.1
0.181
si:dkey-251i10.2
-0.031
CABZ01072848.1
0.180
aox5
-0.031
CABZ01052810.1
0.178
aqp3a
-0.030
trim35-24
0.174
rtn1b
-0.030
illr4
0.169
nupr1a
-0.029
zgc:172014
0.168
slc2a11b
-0.029
nuf2
0.168
bco1
-0.028
numa1
0.165
cd63
-0.027
zgc:112163
0.163
mt-nd1
-0.027
si:dkey-57a22.11
0.161
mylpfa
-0.027
bmp6
0.159
reep5
-0.027
nfat5b
0.158
TMEM19
-0.027
si:dkey-108k21.28
0.157
mlpha
-0.026
zgc:165555.3
0.156
idh1
-0.026
XLOC-013608
0.155
krt18b
-0.026
si:ch211-113a14.18
0.154
vps26a
-0.026
pom121
0.150
cmtm3
-0.025
hist1h4l
0.150
pmp22b
-0.025
znf1067
0.149
vamp3
-0.025
kntc1
0.147
si:dkey-204f11.64
-0.025
XLOC-035949
0.145
rps19
-0.025
LOC110438093
0.145
LOC103910009
-0.025
prc1b
0.143
CABZ01021592.1
-0.024
si:ch211-126c2.4
0.142
pcbd1
-0.024
zgc:153631
0.141
pts
-0.024