Daniocell
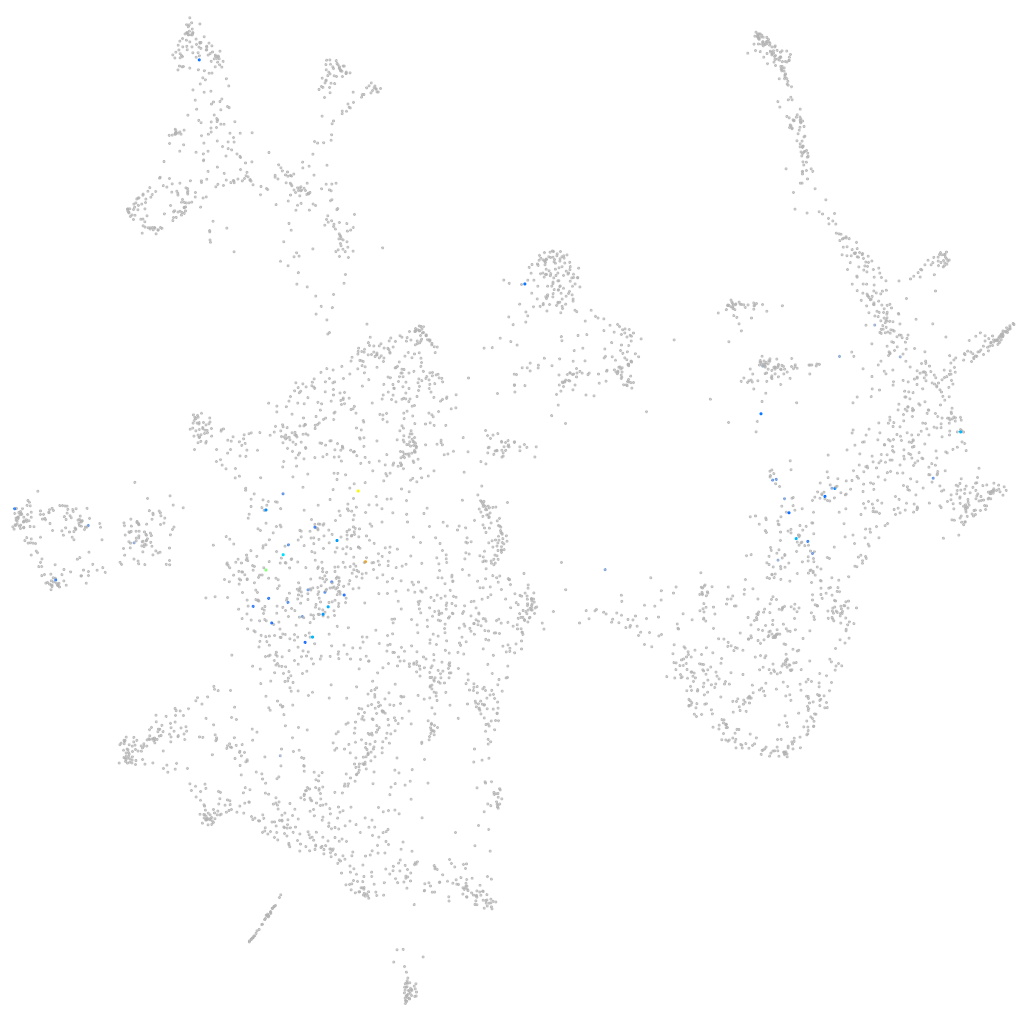
hist1h2a1 (otic / lateral line)
histone cluster 1 H2A family member1
ZFIN
Gene expression UMAP
Display:
Expression
Stage
Other cell groups
all cells
blastomeres
PGCs
endoderm
axial mesoderm
muscle
mural cells /
non-skeletal muscle
mesenchyme
hematopoietic /
vasculature
pronephros
neural
spinal cord / glia
eye
taste / olfactory
otic / lateral line
epidermis
periderm
fin
ionocytes / mucous
pigment cells
Expression by stage/cluster
Correlated gene expression
Positive correlation
Negative correlation
Gene
r
Gene
r
LOC108179355
0.347
eif1b
-0.055
si:ch1073-153i20.4
0.265
pvalb1
-0.055
si:dkey-108k21.10
0.258
pvalb2
-0.053
si:ch211-139l2.1
0.247
fthl27
-0.052
si:ch73-368j24.10
0.234
actc1b
-0.051
LOC110437895
0.234
tob1b
-0.050
hist1h2a4.1
0.232
gabarapb
-0.047
cenpi
0.221
ctsla
-0.045
si:ch211-266k8.4
0.218
eef1g
-0.044
si:ch211-113a14.18
0.216
ppdpfb
-0.044
LOC100331412
0.216
tmem59
-0.043
LOC101882800
0.206
si:dkey-112e7.2
-0.042
zgc:165555.3
0.200
cox4i1
-0.041
si:dkey-261m9.17
0.198
tob1a
-0.040
si:dkey-261m9.12
0.195
gtpbp4
-0.040
zgc:110425
0.189
slc25a5
-0.040
LOC108183320
0.187
mcl1a
-0.040
XLOC-006630
0.187
ucp2
-0.040
chia.1
0.183
papss2b
-0.039
CR936408.2
0.182
actb2
-0.039
kif20ba
0.177
igfbp5b
-0.039
LOC100537816
0.177
map1lc3a
-0.038
fbxo5
0.172
romo1
-0.038
hist1h2a11
0.171
zgc:162730
-0.038
prc1b
0.170
cnpy1
-0.038
FP340257.1
0.168
gabarapl2
-0.037
si:dkey-108k21.11
0.167
apoa2
-0.036
zgc:153405
0.166
gsto2
-0.036
si:dkeyp-104f11.8
0.164
appb
-0.036
arhgap11a
0.162
ddit3
-0.036
si:dkey-108k21.14
0.162
nupr1a
-0.036
si:dkeyp-117h8.4
0.160
itm2ba
-0.036
mibp
0.159
cyp3c1
-0.036
BX323031.2
0.157
rplp2
-0.035
si:ch211-113a14.24
0.156
socs3a
-0.035