Daniocell
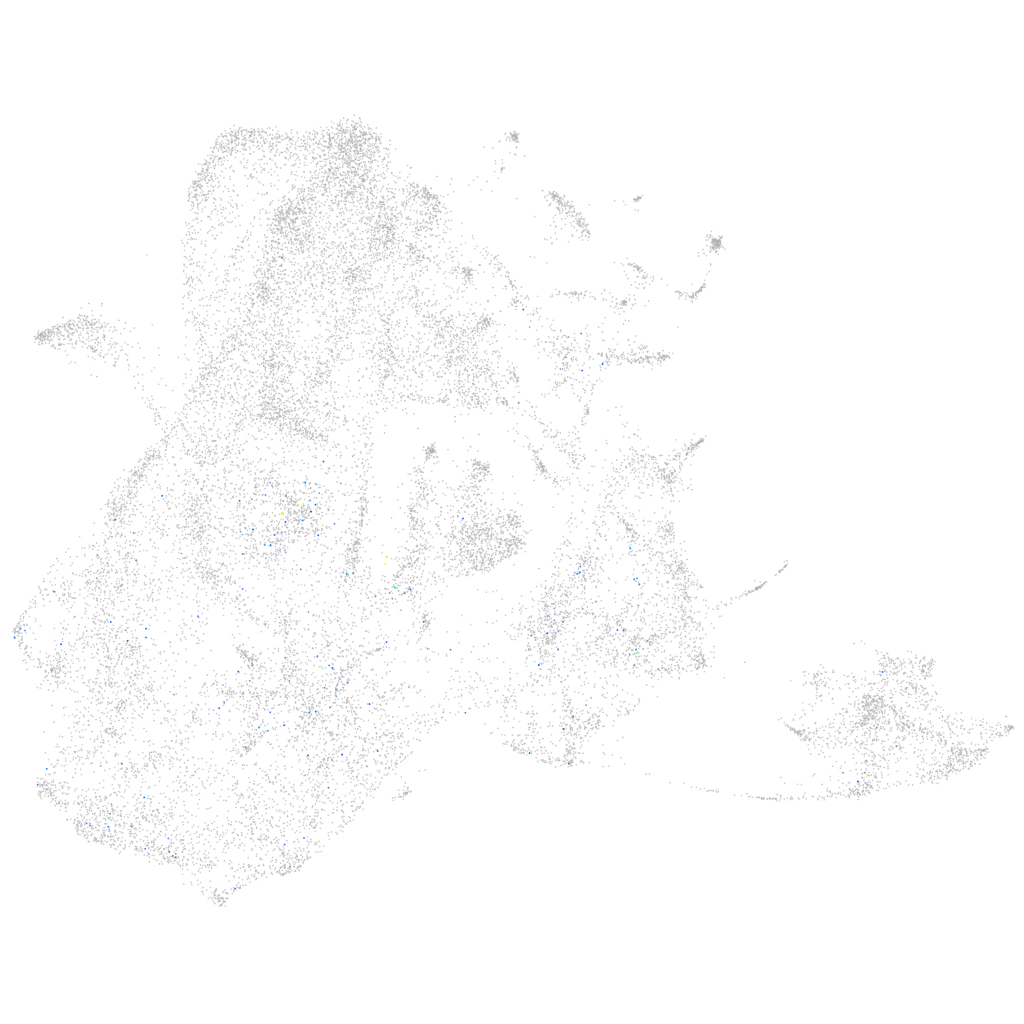
hist1h2a1 (epidermis)
histone cluster 1 H2A family member1
ZFIN
Gene expression UMAP
Display:
Expression
Stage
Other cell groups
all cells
blastomeres
PGCs
endoderm
axial mesoderm
muscle
mural cells /
non-skeletal muscle
mesenchyme
hematopoietic /
vasculature
pronephros
neural
spinal cord / glia
eye
taste / olfactory
otic / lateral line
epidermis
periderm
fin
ionocytes / mucous
pigment cells
Expression by stage/cluster
Correlated gene expression
Positive correlation
Negative correlation
Gene
r
Gene
r
LOC108181115
0.180
tob1b
-0.052
CR847844.1
0.175
si:dkey-33c14.3
-0.051
zgc:165555.3
0.161
krt5
-0.046
hist1h4l
0.153
krt4
-0.045
LOC101886601.1
0.153
krt91
-0.045
zgc:110425
0.146
anxa1a
-0.045
si:dkey-261m9.17
0.143
pfn1
-0.045
si:dkey-108k21.10
0.140
rbp4
-0.045
LOC108181627
0.139
tmsb1
-0.044
mki67
0.134
eef1da
-0.044
hist1h2a3
0.133
krtt1c19e
-0.043
hist1h2a11
0.132
cxl34b.11
-0.042
si:dkey-108k21.12
0.122
zgc:136930
-0.042
kifc1
0.120
aldh9a1a.1
-0.041
top2a
0.119
cebpb
-0.040
CABZ01099833.1
0.119
si:dkey-183i3.5
-0.040
ncapg
0.115
cyt1
-0.040
mibp
0.114
actb2
-0.040
RF00421
0.113
zgc:77439
-0.039
smc2
0.113
cebpd
-0.039
si:ch211-113a14.18
0.113
lgals1l1
-0.039
ncapd2
0.112
cotl1
-0.038
hist1h2a5
0.111
sparc
-0.037
zgc:110216
0.111
capns1a
-0.037
aurkb
0.109
gapdhs
-0.037
kif23
0.109
ier2b
-0.037
si:ch211-113a14.24
0.109
epgn
-0.036
alox5b.3
0.108
tmem238a
-0.036
iqgap3
0.107
cldn1
-0.036
zgc:153409
0.106
aqp3a
-0.036
ccnb2
0.106
cdo1
-0.035
zgc:113984.1
0.106
lgals3b
-0.035
ccna2
0.105
cfl1l
-0.035
mad2l1
0.105
itm2bb
-0.034
zgc:153405
0.103
ak1
-0.034