Daniocell
hist1h2a1 (taste / olfactory)
histone cluster 1 H2A family member1
ZFIN
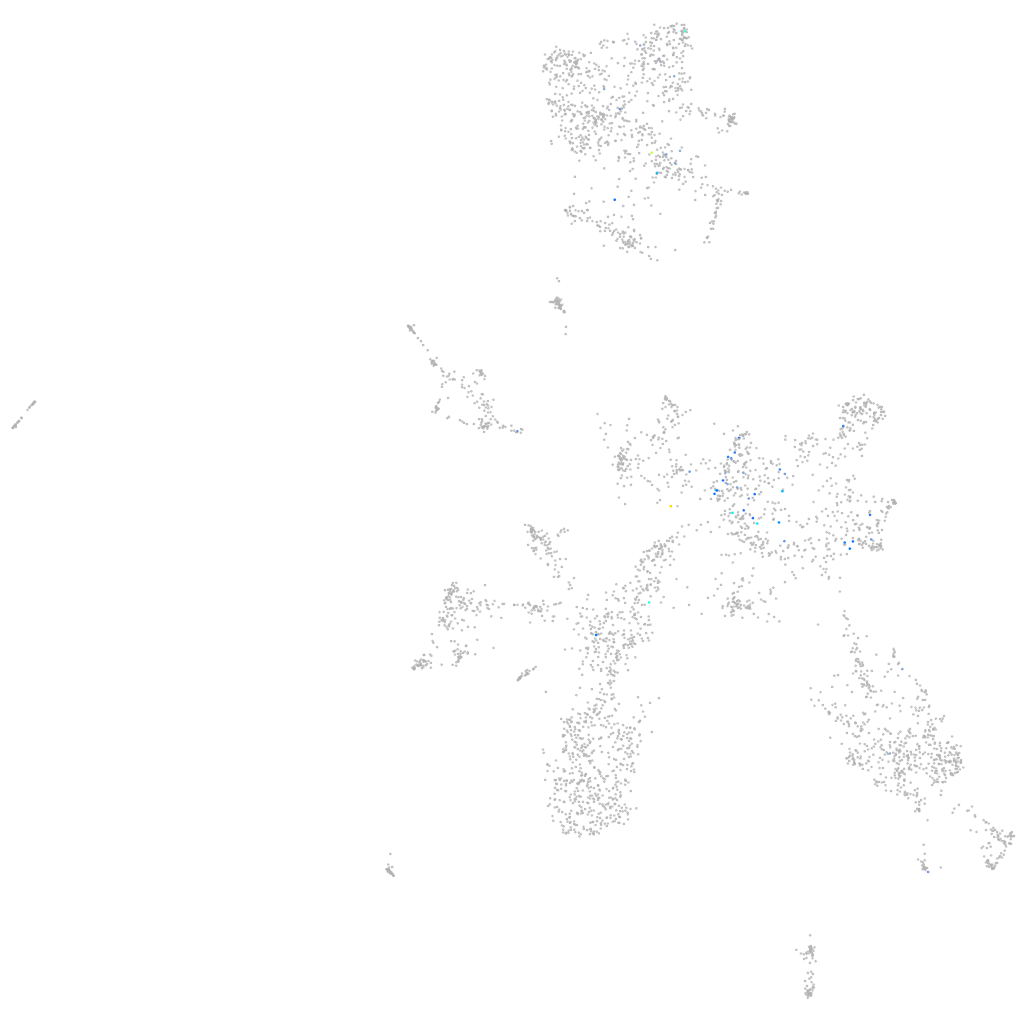
Gene expression UMAP
Display:
Expression
Stage
Other cell groups
all cells
blastomeres
PGCs
endoderm
axial mesoderm
muscle
mural cells /
non-skeletal muscle
mesenchyme
hematopoietic /
vasculature
pronephros
neural
spinal cord / glia
eye
taste / olfactory
otic / lateral line
epidermis
periderm
fin
ionocytes / mucous
pigment cells
Expression by stage/cluster
Correlated gene expression
Positive correlation
Negative correlation
Gene
r
Gene
r
LOC101885611
0.348
gabarapb
-0.081
si:dkey-108k21.14
0.343
gstp1
-0.080
LOC101885256
0.318
selenow2b
-0.073
XLOC-003052
0.313
gnb1a
-0.072
si:dkeyp-41f9.4
0.291
CR383676.1
-0.071
znf1097
0.257
tegt
-0.071
gpr18
0.248
oaz1a
-0.070
znf1034
0.246
selenow1
-0.070
hist1h2a11
0.245
itm2ba
-0.069
LOC110438254
0.232
ldhba
-0.069
skor1b
0.225
tmem59
-0.068
BX005380.2
0.225
atp1b1a
-0.068
si:ch211-113a14.26
0.218
gsto2
-0.068
hist1h4l
0.218
txn
-0.066
LOC103909828
0.215
selenot1a
-0.065
si:ch211-113a14.18
0.212
si:ch211-196l7.4
-0.065
LOC100334934
0.203
gsnb
-0.065
klhl5
0.196
spint2
-0.064
si:ch211-113a14.27
0.187
cldnh
-0.064
zgc:110216
0.187
atp6v1e1b
-0.064
LOC101886429
0.186
mgst3a
-0.063
rbm33b
0.184
eif1b
-0.062
si:dkey-108k21.10
0.184
bsg
-0.062
obscnb
0.182
hspa5
-0.062
si:dkey-261m9.18
0.181
atox1
-0.062
zgc:165555.3
0.180
lasp1
-0.062
si:dkey-23a13.17
0.176
rps27l
-0.061
CR354435.1
0.176
zgc:165573
-0.061
si:dkey-261m9.17
0.174
si:ch1073-443f11.2
-0.061
si:ch211-113a14.24
0.170
dnaja2a
-0.061
CU457819.1
0.167
wu:fb18f06
-0.061
si:dkey-108k21.19
0.167
hsbp1a
-0.061
prdm13
0.164
anxa5b
-0.060
si:dkey-108k21.24
0.160
camk2n1a
-0.060
moxd1
0.160
ssr3
-0.059