Daniocell
adat3 (fin)
adenosine deaminase tRNA specific 3
ZFIN
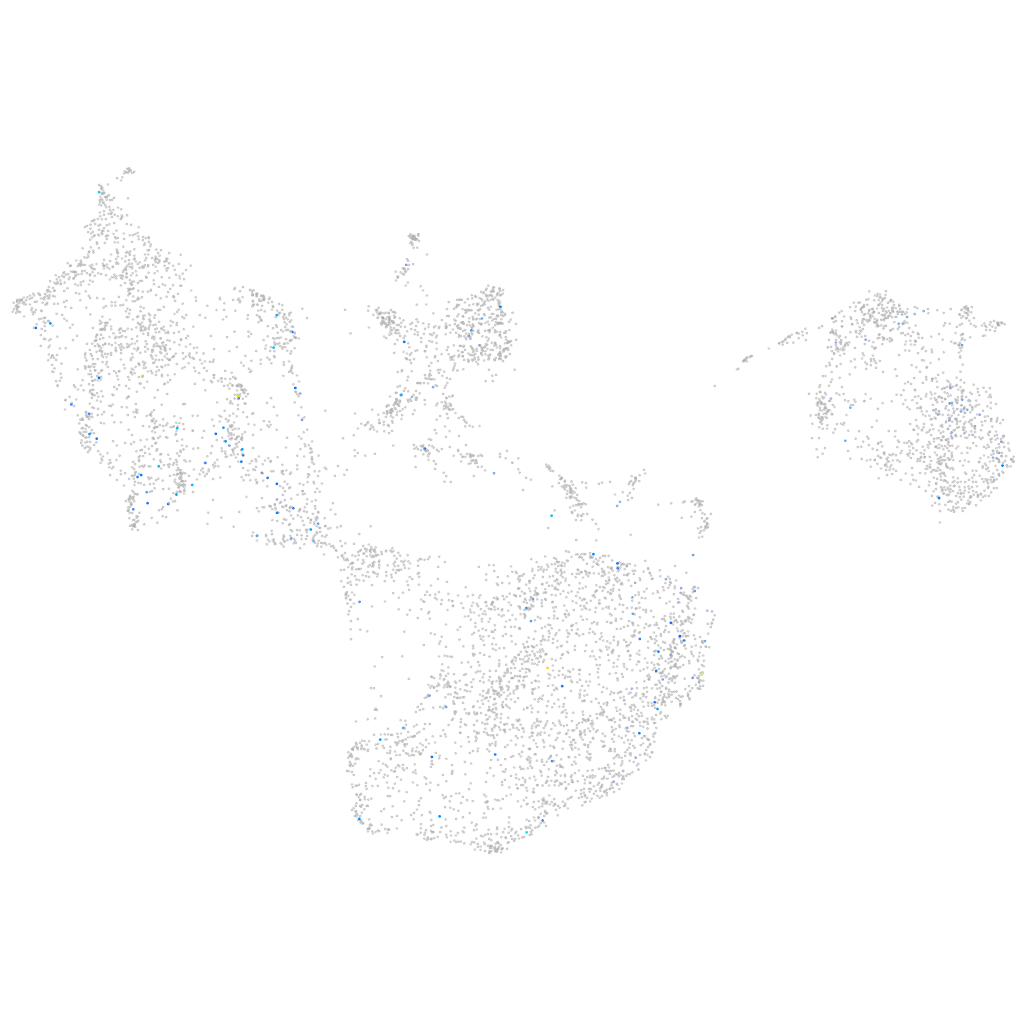
Gene expression UMAP
Display:
Expression
Stage
Other cell groups
all cells
blastomeres
PGCs
endoderm
axial mesoderm
muscle
mural cells /
non-skeletal muscle
mesenchyme
hematopoietic /
vasculature
pronephros
neural
spinal cord / glia
eye
taste / olfactory
otic / lateral line
epidermis
periderm
fin
ionocytes / mucous
pigment cells
Expression by stage/cluster
Correlated gene expression
Positive correlation
Negative correlation
Gene
r
Gene
r
BX248410.1
0.197
aqp3a
-0.045
XLOC-039714
0.140
ecrg4a
-0.044
CU207245.1
0.137
and2
-0.044
cdnf
0.133
ucp1
-0.040
stxbp4
0.128
hpdb
-0.038
LOC101884770
0.125
rap1b
-0.038
slx4
0.121
si:dkey-12l12.1
-0.037
LOC101885907
0.121
ptx3a
-0.037
si:ch211-193k19.2
0.118
vwa2
-0.034
pvalb3
0.117
rhbdl2
-0.033
si:ch73-236j9.2
0.116
selenow1
-0.033
LOC101886337
0.111
CABZ01092746.1
-0.033
si:dkey-246g23.2
0.108
tmsb4x
-0.032
PSTK
0.108
ppt1
-0.031
CU179756.1
0.108
msx1b
-0.031
si:ch211-145h19.5
0.108
calm2b
-0.031
si:ch73-233m11.2
0.107
mdh1aa
-0.030
fam149a
0.106
bambib
-0.030
BX005328.1
0.105
bcam
-0.029
LOC101884995
0.103
si:ch211-243g18.2
-0.029
CABZ01113467.1
0.102
calm1a
-0.029
BX927300.1
0.101
sp9
-0.029
XLOC-022776
0.101
sh3gl1a
-0.029
prnpb
0.099
dlx3b
-0.028
ern2
0.099
fras1
-0.028
LOC100149554.1
0.097
si:ch211-76l23.4
-0.028
CU928129.1
0.097
txn
-0.027
CABZ01044099.1
0.096
ttc36
-0.027
LOC110439953
0.094
gpr31
-0.027
XLOC-038909
0.093
pafah1b1a
-0.027
ftr16
0.093
fbln1
-0.027
XLOC-014911
0.093
emilin2b
-0.027
kcnh1a
0.092
meis1b
-0.026
si:ch73-380l10.2
0.092
gli3
-0.026
ZNF335
0.092
pah
-0.026