Daniocell
adat3 (endoderm)
adenosine deaminase tRNA specific 3
ZFIN
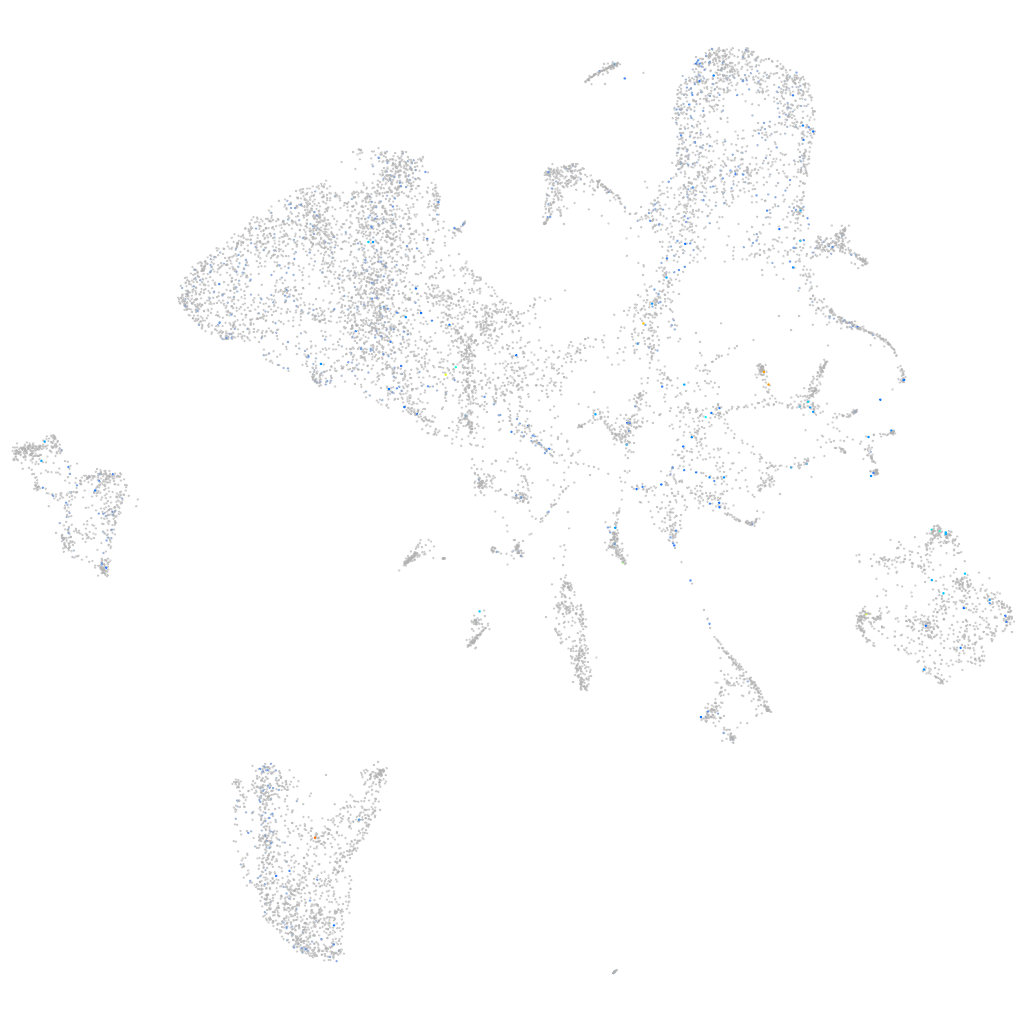
Gene expression UMAP
Display:
Expression
Stage
Other cell groups
all cells
blastomeres
PGCs
endoderm
axial mesoderm
muscle
mural cells /
non-skeletal muscle
mesenchyme
hematopoietic /
vasculature
pronephros
neural
spinal cord / glia
eye
taste / olfactory
otic / lateral line
epidermis
periderm
fin
ionocytes / mucous
pigment cells
Expression by stage/cluster
Correlated gene expression
Positive correlation
Negative correlation
Gene
r
Gene
r
ak8
0.233
cst14b.1
-0.032
cga
0.201
pvalb9
-0.029
tshr
0.196
selenow1
-0.029
LOC101882800
0.186
mylpfa
-0.028
CABZ01066921.1
0.185
BX908782.1
-0.027
si:dkey-27j5.5
0.181
cav1
-0.027
LOC101887114
0.168
zgc:92137
-0.027
trpm2-as
0.166
si:dkey-31g6.6
-0.027
XLOC-004668
0.159
tent5bb
-0.027
AL929237.1
0.148
myl9b
-0.027
si:ch211-151m7.6
0.142
wipi1
-0.027
si:ch211-223a21.3
0.139
bhmt
-0.026
si:ch211-57i17.5
0.136
pla2g1b
-0.026
XLOC-026746
0.135
myh9a
-0.026
six2b
0.134
lpin1
-0.026
zmp:0000000755
0.133
c6ast4
-0.026
si:dkey-264f17.2
0.128
rpz5
-0.026
XLOC-008693
0.128
ttn.2
-0.025
si:dkey-178e17.3
0.126
cpa1
-0.025
CU459065.1
0.125
cel.1
-0.025
il16
0.123
asb11
-0.025
si:ch73-261i21.5
0.123
apoc1
-0.025
si:dkey-6n21.13
0.121
cel.2
-0.025
tnk2a
0.120
csrnp1b
-0.025
XLOC-014770
0.119
ctrl
-0.024
zgc:194665
0.119
tbx1
-0.024
DNAH10
0.117
ip6k2a
-0.024
BX005442.1
0.116
ckmb
-0.024
tenm1
0.112
fnbp4
-0.024
stmn3
0.110
spock3
-0.024
PITPNC1
0.110
gas1a
-0.023
si:dkeyp-82b4.3
0.109
prss1
-0.023
nrip2
0.104
eps8l1b
-0.023
anxa5a
0.104
zgc:66160
-0.023
zgc:123299
0.101
acp5a
-0.023