Daniocell
adat3 (pronephros)
adenosine deaminase tRNA specific 3
ZFIN
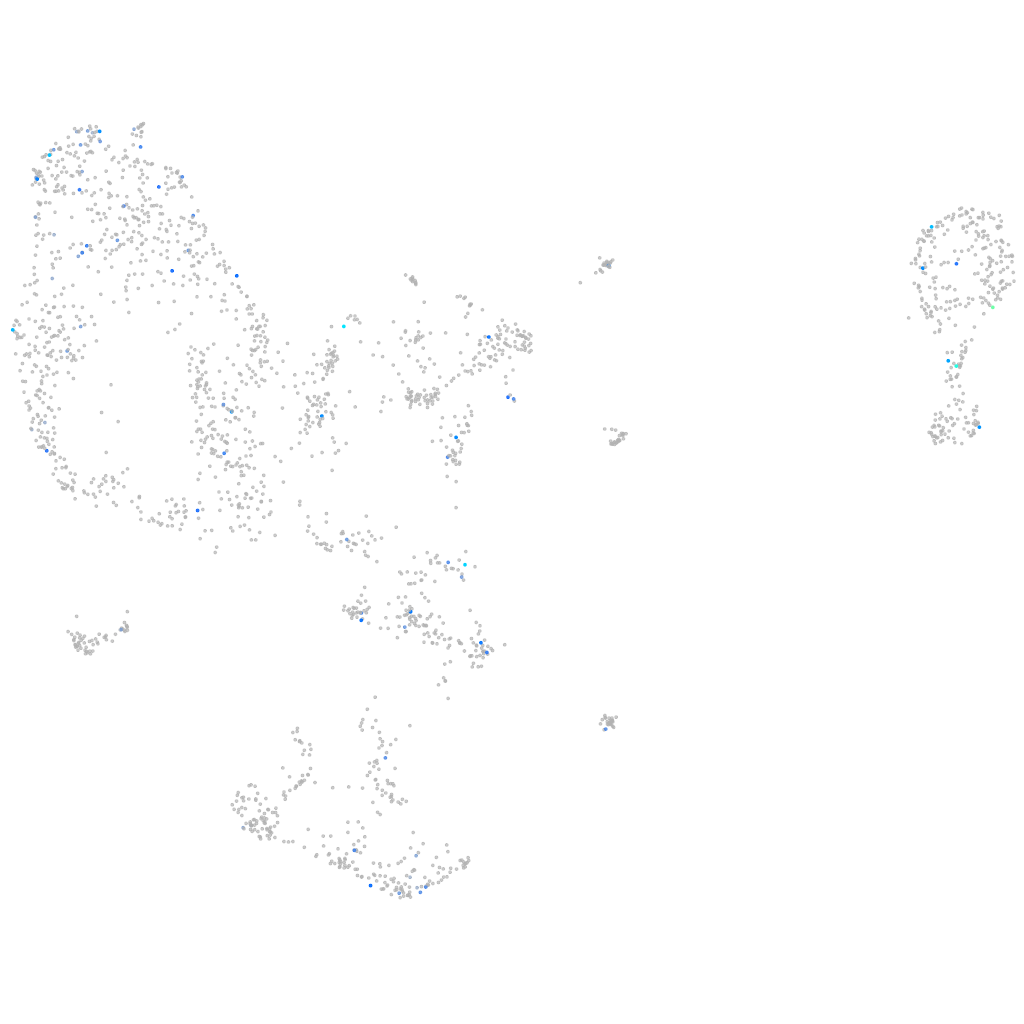
Gene expression UMAP
Display:
Expression
Stage
Other cell groups
all cells
blastomeres
PGCs
endoderm
axial mesoderm
muscle
mural cells /
non-skeletal muscle
mesenchyme
hematopoietic /
vasculature
pronephros
neural
spinal cord / glia
eye
taste / olfactory
otic / lateral line
epidermis
periderm
fin
ionocytes / mucous
pigment cells
Expression by stage/cluster
Correlated gene expression
Positive correlation
Negative correlation
Gene
r
Gene
r
si:ch211-162i8.2
0.322
CR383676.1
-0.059
LOC103908923
0.283
u2surp
-0.051
CR925879.1
0.263
pnrc2
-0.049
LOC559501
0.231
zgc:153409
-0.048
si:ch211-209n20.59
0.227
hsbp1a
-0.046
si:dkeyp-53d3.5
0.215
si:dkey-26c10.5
-0.045
znf1116
0.213
ppp1r11
-0.044
CABZ01038493.1
0.213
slbp
-0.044
LOC101885678
0.208
fabp3
-0.044
LOC101885726
0.208
mcee
-0.044
gypc
0.203
znf622
-0.043
LOC103910598
0.201
rsph10b
-0.043
myct1b
0.199
CR356236.1
-0.043
bcl6b
0.196
nrg1
-0.043
LOC110438448
0.190
alkbh5
-0.042
zgc:153896
0.186
ggnbp2
-0.042
zgc:163083
0.184
vdrb
-0.042
FP245526.1
0.181
rab11fip1a
-0.042
si:ch211-209j12.3
0.181
usp4
-0.041
csf1a
0.179
phyhiplb
-0.041
LOC100535496
0.178
vps25
-0.041
card11
0.174
cers3b
-0.041
fgf1b
0.170
abhd17ab
-0.041
wnt1
0.165
pleca
-0.041
LOC103911487
0.163
zc3h14
-0.040
mtx3
0.163
dido1
-0.040
si:dkey-219c3.2
0.162
RSPH1
-0.040
itpr2
0.161
rerea
-0.040
tpbgl
0.150
paox1
-0.040
slc39a5
0.150
prim1
-0.040
XLOC-042234
0.150
deptor
-0.040
atoh1c
0.149
cldn10b
-0.039
shpk
0.149
iqcg
-0.039
si:ch211-226h8.6
0.149
si:ch211-121a2.2
-0.039
LOC101885908
0.145
ak7a
-0.039