Daniocell
adat3 (pigment cells)
adenosine deaminase tRNA specific 3
ZFIN
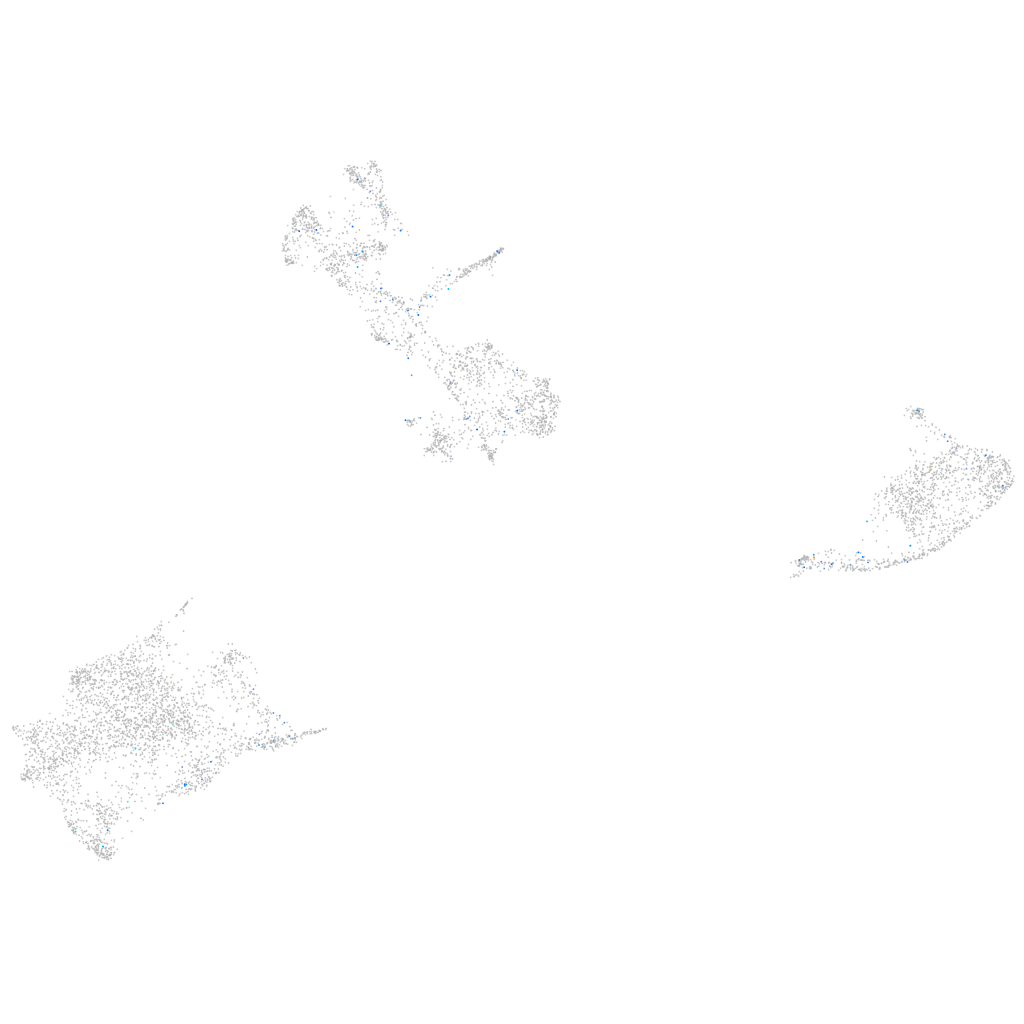
Gene expression UMAP
Display:
Expression
Stage
Other cell groups
all cells
blastomeres
PGCs
endoderm
axial mesoderm
muscle
mural cells /
non-skeletal muscle
mesenchyme
hematopoietic /
vasculature
pronephros
neural
spinal cord / glia
eye
taste / olfactory
otic / lateral line
epidermis
periderm
fin
ionocytes / mucous
pigment cells
Expression by stage/cluster
Correlated gene expression
Positive correlation
Negative correlation
Gene
r
Gene
r
LOC108182930
0.229
gstp1
-0.047
klf10
0.205
gch2
-0.043
CU179756.1
0.178
pvalb2
-0.043
plch2b
0.173
icn
-0.041
zmp:0000001316
0.170
CABZ01021592.1
-0.038
TMEM196 (1 of many)
0.167
s100a10b
-0.037
CABZ01117357.1
0.164
si:dkey-251i10.2
-0.035
sp6
0.158
nme2b.2
-0.033
CU856621.2
0.151
ckma
-0.032
LOC103910717
0.151
actc1b
-0.030
march11
0.148
uraha
-0.030
si:ch73-337l15.2
0.146
anxa1a
-0.030
XLOC-022250
0.146
hbbe1.1
-0.029
XLOC-004987
0.146
tmsb4x
-0.029
si:dkey-103k4.1
0.140
hbae3
-0.029
fmnl1a
0.136
mdh1aa
-0.028
v2ra18
0.136
pvalb1
-0.028
si:ch1073-140o9.2
0.134
tmem130
-0.028
CR855865.1
0.131
mt-co2
-0.027
LOC101883107
0.128
cd63
-0.027
CR848705.2
0.124
slc22a7a
-0.026
LOC110437996
0.124
rtn1b
-0.025
BX323031.1
0.120
prdx1
-0.024
BX294178.2
0.119
hbae1.3
-0.024
alpk2
0.118
myhz1.1
-0.023
CR954963.1
0.113
krtt1c19e
-0.023
gata1a
0.109
myhz1.2
-0.023
cdh16
0.108
ttn.1
-0.023
XLOC-025455
0.108
mylpfa
-0.022
slc38a8a
0.106
rhag
-0.022
pcxa
0.106
csrp2
-0.022
LOC100536607
0.105
zgc:110339
-0.022
XLOC-042222
0.104
zgc:153031
-0.021
zgc:153659
0.103
pts
-0.021
irf8
0.103
XLOC-003689
-0.020