Daniocell
adat3 (mesenchyme)
adenosine deaminase tRNA specific 3
ZFIN
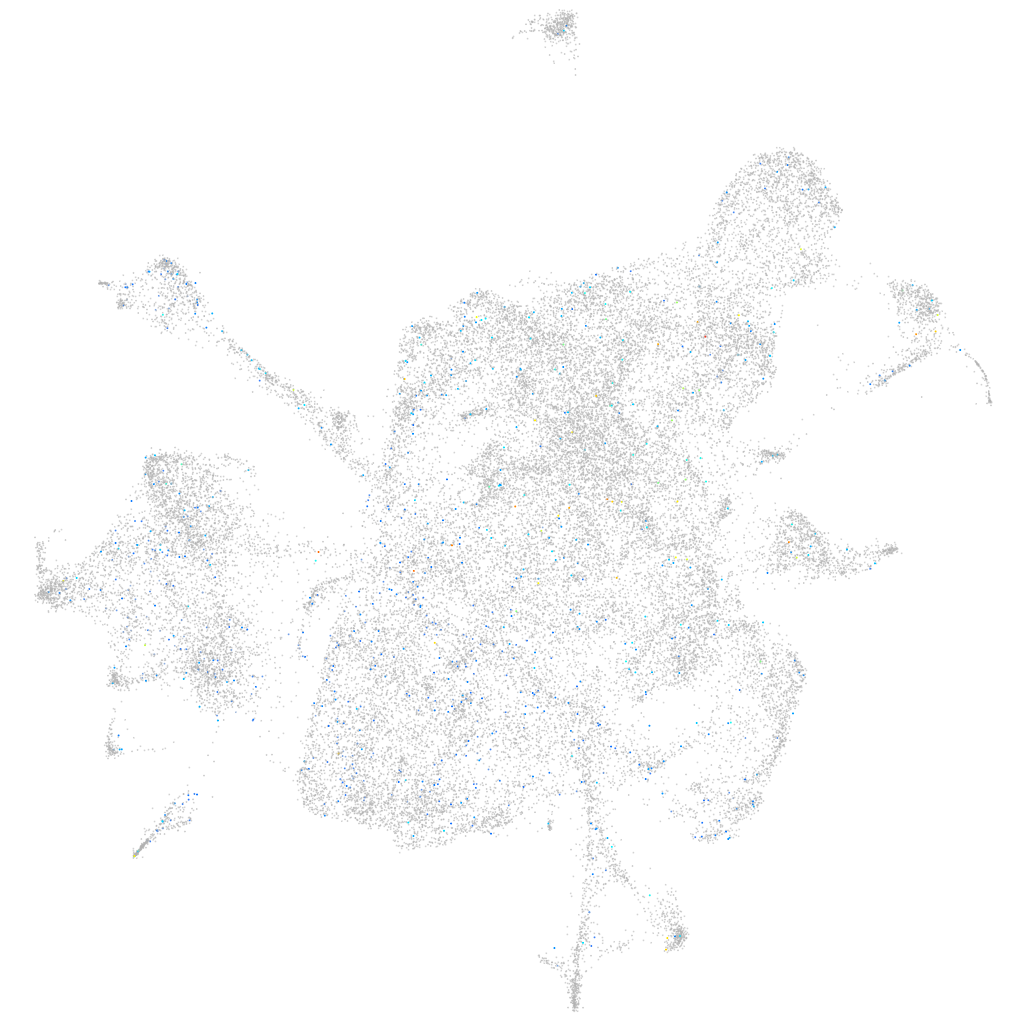
Gene expression UMAP
Display:
Expression
Stage
Other cell groups
all cells
blastomeres
PGCs
endoderm
axial mesoderm
muscle
mural cells /
non-skeletal muscle
mesenchyme
hematopoietic /
vasculature
pronephros
neural
spinal cord / glia
eye
taste / olfactory
otic / lateral line
epidermis
periderm
fin
ionocytes / mucous
pigment cells
Expression by stage/cluster
Correlated gene expression
Positive correlation
Negative correlation
Gene
r
Gene
r
si:ch73-379f5.5
0.098
col5a1
-0.029
LOC103910192
0.098
col1a1b
-0.022
CU929145.1
0.096
col1a2
-0.021
LOC100538255
0.091
col1a1a
-0.020
LO018107.1
0.080
sparc
-0.020
FO082779.2
0.077
mfap5
-0.020
si:ch73-106l15.4
0.075
col11a1b
-0.019
il17a/f3
0.074
fkbp10b
-0.019
cnr2
0.071
postnb
-0.018
si:dkey-29p23.2
0.071
serpinh1b
-0.017
CU468164.1
0.068
col6a2
-0.017
XLOC-041559
0.068
col6a1
-0.017
krt95
0.065
col11a2
-0.017
XLOC-036658
0.065
col2a1b
-0.016
zgc:123284
0.061
ucmab
-0.016
si:dkeyp-100a1.6
0.061
timp2a
-0.016
XLOC-028373
0.052
col11a1a
-0.016
nop58
0.052
twist1b
-0.016
npm1a
0.051
chd3
-0.016
XLOC-012620
0.051
p4hb
-0.016
snu13b
0.050
rock2b
-0.016
AL954359.1
0.050
col5a2a
-0.015
FO818699.1
0.049
dcn
-0.015
BX088688.3
0.049
col9a1a
-0.015
nop56
0.049
fgfr2
-0.015
BX571843.1
0.048
serpinf1
-0.015
si:ch211-151h10.2
0.048
col9a3
-0.015
ovol1b
0.047
ccdc80
-0.015
LOC100536800
0.046
si:ch211-178n15.1
-0.015
LOC100536949
0.046
cgref1
-0.015
XLOC-016856
0.045
ldlrap1a
-0.015
ncl
0.045
rcn3
-0.015
ovgp1
0.044
bhmt
-0.015
grna
0.044
kdelr3
-0.015
XLOC-020187
0.043
ier2b
-0.015