Daniocell
adat3 (mural cells / non-skeletal muscle)
adenosine deaminase tRNA specific 3
ZFIN
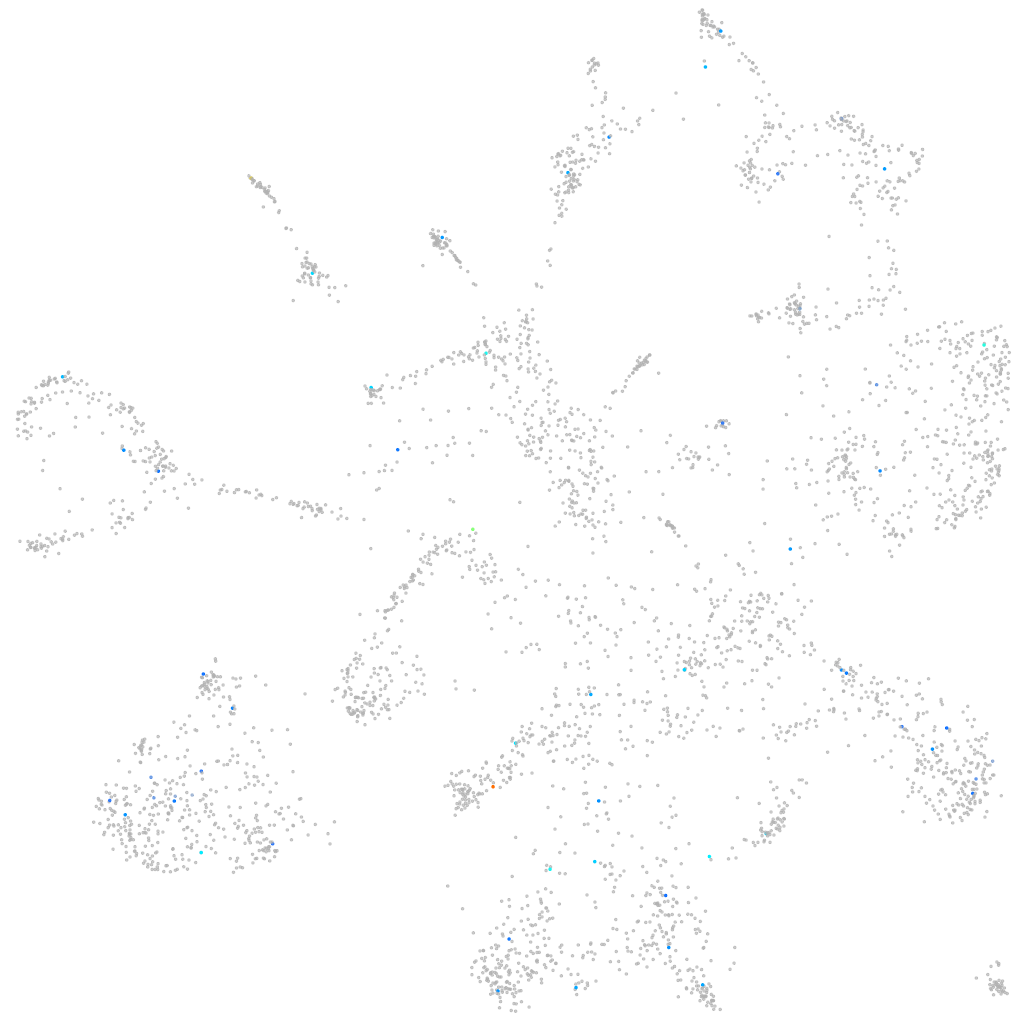
Gene expression UMAP
Display:
Expression
Stage
Other cell groups
all cells
blastomeres
PGCs
endoderm
axial mesoderm
muscle
mural cells /
non-skeletal muscle
mesenchyme
hematopoietic /
vasculature
pronephros
neural
spinal cord / glia
eye
taste / olfactory
otic / lateral line
epidermis
periderm
fin
ionocytes / mucous
pigment cells
Expression by stage/cluster
Correlated gene expression
Positive correlation
Negative correlation
Gene
r
Gene
r
CR387996.1
0.351
rps24
-0.045
diras1b
0.254
ndnf
-0.040
OTOP1
0.233
zgc:158463
-0.037
si:dkeyp-117b11.3
0.224
inka1a
-0.033
btr12
0.197
rps25
-0.033
LOC108181107
0.194
sh3bgrl2
-0.032
XLOC-006820
0.192
rbpms2b
-0.031
si:ch73-206d17.1
0.190
dync1li2
-0.031
or106-10
0.185
rps23
-0.031
CR759810.1
0.183
rps12
-0.031
st6galnac1.2
0.177
ska2
-0.030
LOC101885649
0.174
nipblb
-0.030
LOC108183743
0.165
ptch1
-0.029
LOC103908612
0.165
rock2a
-0.029
si:dkey-18p12.4
0.162
tmeff1b
-0.029
RF00408
0.162
nid1b
-0.029
si:ch211-272b8.6
0.159
mfap1
-0.029
wee2
0.159
kank2
-0.029
LOC103910422
0.157
gpm6bb
-0.029
CABZ01071326.1
0.155
mycn
-0.028
nlgn3b
0.154
SCARF2
-0.028
eef1a1l2
0.154
rps20
-0.028
LOC101885705.1
0.153
zgc:77086
-0.028
fga
0.150
si:dkey-46a10.3
-0.027
dtnbb
0.146
b2ml
-0.027
ppp1r3db
0.143
LOC110438079
-0.027
slc25a21
0.142
kmt2e
-0.027
si:ch211-66e2.3
0.140
si:ch211-183d21.1
-0.027
myo9bl
0.140
metrn
-0.026
noxo1b
0.139
lhfpl2a
-0.026
zgc:194551
0.139
si:ch1073-440b2.1
-0.026
BX927300.1
0.137
foxp1b
-0.026
LOC108180139
0.136
meis3
-0.026
si:dkey-13a21.4
0.134
si:ch73-173h19.3
-0.026
BX470259.3
0.134
zfp36l1a
-0.026