Daniocell
vimr2 (neural)
vimentin-related 2
ZFIN
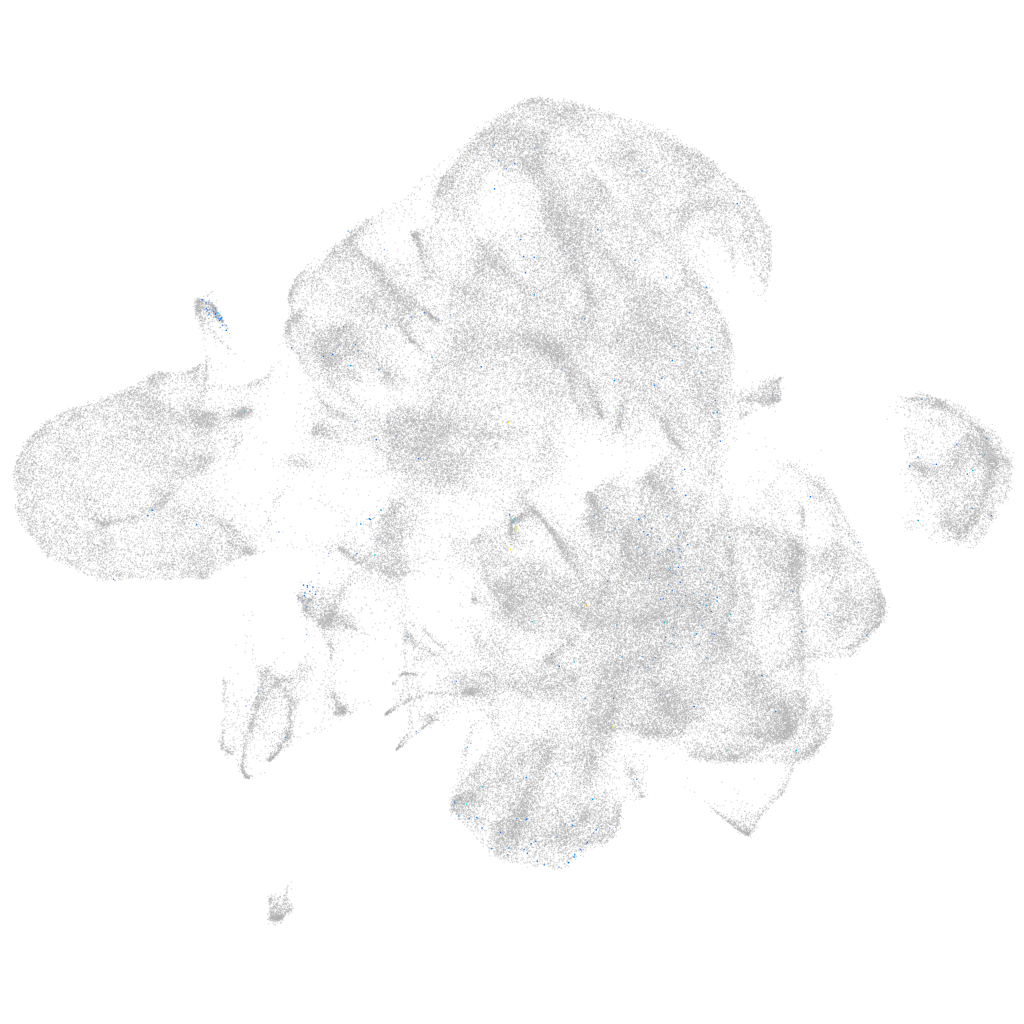
Gene expression UMAP
Display:
Expression
Stage
Other cell groups
all cells
blastomeres
PGCs
endoderm
axial mesoderm
muscle
mural cells /
non-skeletal muscle
mesenchyme
hematopoietic /
vasculature
pronephros
neural
spinal cord / glia
eye
taste / olfactory
otic / lateral line
epidermis
periderm
fin
ionocytes / mucous
pigment cells
Expression by stage/cluster
Correlated gene expression
Positive correlation
Negative correlation
Gene
r
Gene
r
ednrab
0.075
mdkb
-0.014
si:ch211-117c9.2
0.071
cspg5a
-0.013
lin28a
0.056
hmgb2a
-0.012
XLOC-009257
0.055
zic2b
-0.012
si:ch211-131k2.2
0.054
ccnb1
-0.012
th2
0.053
si:ch73-281n10.2
-0.012
rnf151
0.052
pax3a
-0.012
LOC101886779
0.051
ccna2
-0.011
BX005380.2
0.048
supt16h
-0.011
ngs
0.048
mki67
-0.011
zbbx
0.048
sox3
-0.011
LOC110438000
0.048
stmn1a
-0.011
CR382325.1
0.047
anp32e
-0.011
kcnj2b
0.046
nucks1b
-0.011
slc7a9
0.045
banf1
-0.011
ihhb
0.045
lig1
-0.011
CRACR2A
0.044
fbxo5
-0.011
slc2a11b
0.044
dlgap5
-0.010
ndufa4l2a
0.043
rpa3
-0.010
si:dkeyp-118a3.2
0.042
mad2l1
-0.010
crestin
0.040
akap12b
-0.010
zgc:195050
0.039
srsf1a
-0.010
LOC101886926
0.039
tmpoa
-0.010
si:dkey-31e10.5
0.039
alcamb
-0.010
XLOC-035907
0.038
apoc1
-0.010
si:ch1073-284b18.2
0.037
si:ch211-152c2.3
-0.010
XLOC-042222
0.037
ube2c
-0.010
XLOC-032159
0.037
zic3
-0.010
LOC101885649
0.036
mphosph10
-0.010
CLEC3A
0.036
tpx2
-0.010
LOC101886442
0.036
sox19a
-0.010
si:ch211-262i1.4
0.036
aurka
-0.009
si:dkey-250k10.4
0.035
gas1b
-0.009
BX649431.4
0.035
CR786577.1
-0.009
cobll1a
0.035
msi1
-0.009