Daniocell
vimr2 (hematopoietic / vasculature)
vimentin-related 2
ZFIN
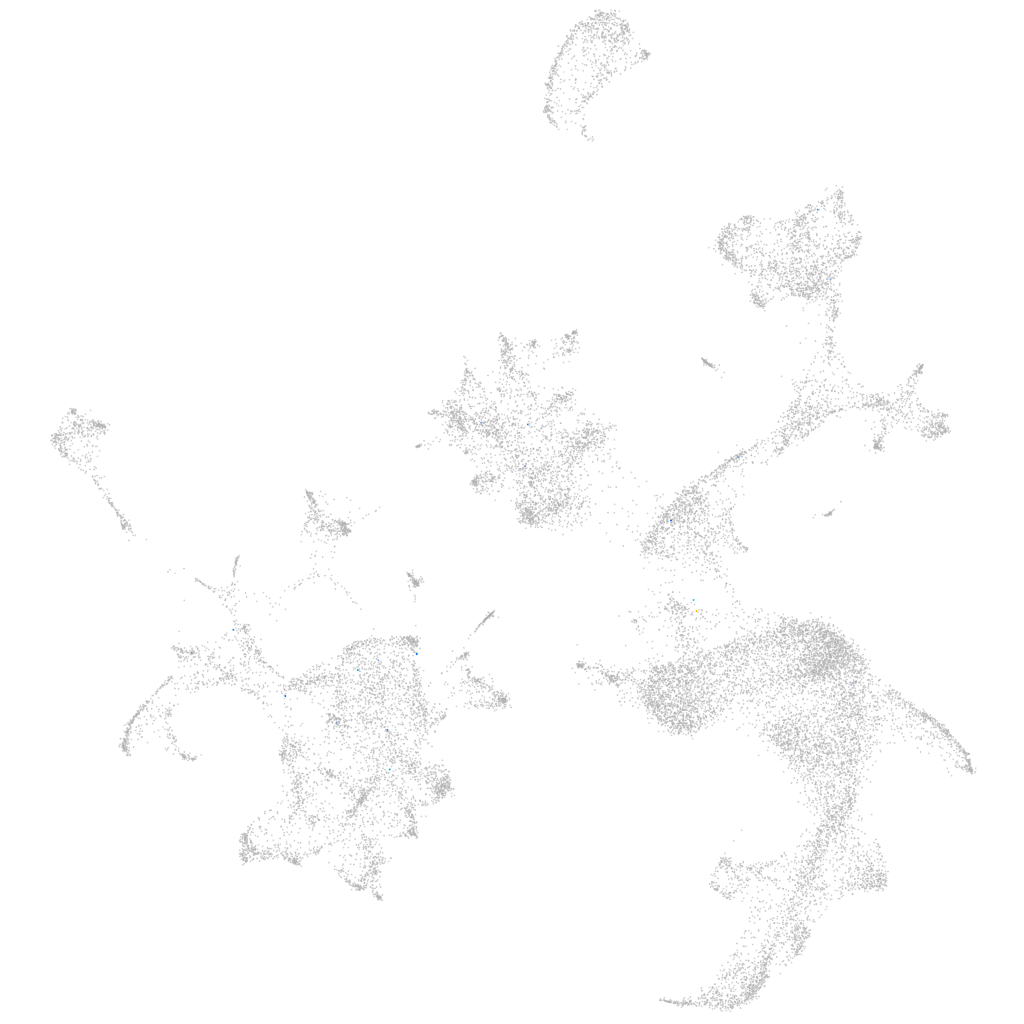
Gene expression UMAP
Display:
Expression
Stage
Other cell groups
all cells
blastomeres
PGCs
endoderm
axial mesoderm
muscle
mural cells /
non-skeletal muscle
mesenchyme
hematopoietic /
vasculature
pronephros
neural
spinal cord / glia
eye
taste / olfactory
otic / lateral line
epidermis
periderm
fin
ionocytes / mucous
pigment cells
Expression by stage/cluster
Correlated gene expression
Positive correlation
Negative correlation
Gene
r
Gene
r
pimr213
0.292
tspo
-0.018
si:ch211-140l13.3
0.276
tmod4
-0.015
si:dkey-27n6.1
0.259
selenoj
-0.013
cx36.7
0.239
si:ch211-207c6.2
-0.013
XLOC-039631
0.230
pvalb1
-0.012
myo3a
0.203
hemgn
-0.012
XLOC-036509
0.176
blvrb
-0.012
XLOC-012652
0.175
hbbe1.2
-0.012
si:ch73-256j6.5
0.170
mcl1a
-0.011
si:ch73-299h12.4
0.166
mbnl1
-0.011
cdk20
0.163
isca1
-0.011
dazl
0.158
guk1a
-0.011
si:ch211-205a14.7
0.158
CR293511.1
-0.011
BX005396.1
0.156
ucp3
-0.011
ryr2b
0.137
alas2
-0.010
BX000701.2
0.132
slc11a2
-0.010
zgc:113343
0.130
slc16a10
-0.010
LOC108191949
0.128
trappc2l
-0.010
si:ch1073-178p5.3
0.128
atp5if1b
-0.010
si:dkey-29p23.1
0.117
tab1
-0.010
LOC100008030
0.112
hbae5
-0.010
LOC103911060
0.111
apoa1b
-0.010
mcm8
0.110
nprl3
-0.010
katnal1
0.108
rhd
-0.010
slc44a5b
0.101
cyt1
-0.010
LOC108179220
0.098
tmub1
-0.009
or112-1
0.097
ak3
-0.009
XLOC-034394
0.096
tfr1a
-0.009
cmlc1
0.096
icn2
-0.009
COLEC10
0.095
rfesd
-0.009
myl7
0.094
LOC108179634
-0.009
snapc2
0.092
hbbe2
-0.009
LOC103910192
0.092
alad
-0.009
comta
0.090
rpl18a
-0.009
ms4a17a.17
0.089
hbbe3
-0.009