Daniocell
vimr2 (mural cells / non-skeletal muscle)
vimentin-related 2
ZFIN
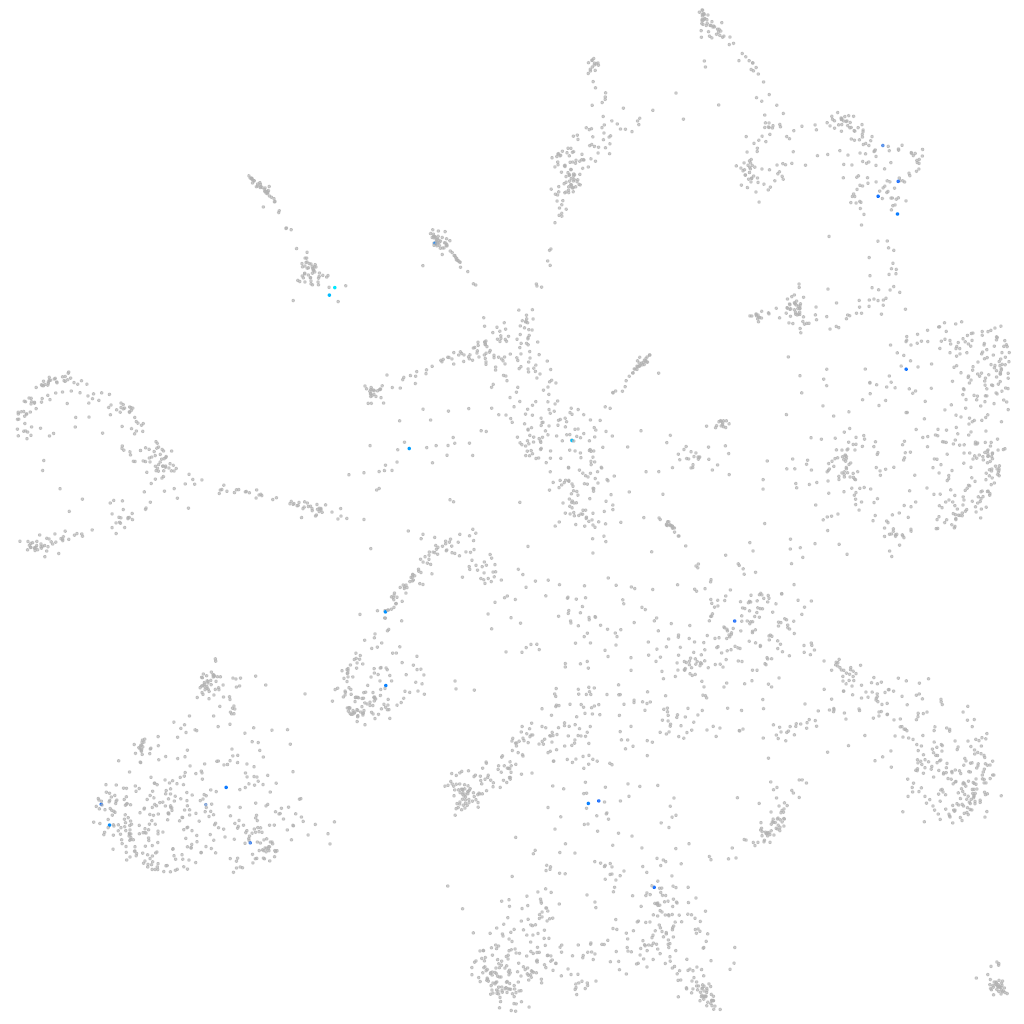
Gene expression UMAP
Display:
Expression
Stage
Other cell groups
all cells
blastomeres
PGCs
endoderm
axial mesoderm
muscle
mural cells /
non-skeletal muscle
mesenchyme
hematopoietic /
vasculature
pronephros
neural
spinal cord / glia
eye
taste / olfactory
otic / lateral line
epidermis
periderm
fin
ionocytes / mucous
pigment cells
Expression by stage/cluster
Correlated gene expression
Positive correlation
Negative correlation
Gene
r
Gene
r
si:ch211-125e6.11
0.317
rps21
-0.057
rtn4rl2b
0.279
lxn
-0.045
LOC100538333
0.279
rpl6
-0.040
eps8l1b
0.240
rpl32
-0.040
si:dkey-85n7.8
0.209
mt-co2
-0.037
si:ch73-167f10.1
0.204
rpl29
-0.036
tacr1b
0.204
sec62
-0.035
si:dkey-92f12.2
0.202
ctgfa
-0.035
noxa1
0.201
rhag
-0.034
cfap206
0.200
si:dkey-177p2.6
-0.033
lcp2a
0.196
eif4h
-0.033
lrp2bp
0.196
cavin1b
-0.033
LOC110438367
0.194
lsm3
-0.032
lad1
0.192
lgals3b
-0.032
si:dkey-94f20.4
0.186
rps6
-0.031
LOC110440213
0.185
nid1a
-0.031
sh2d5
0.183
ntn5
-0.031
FP236331.1
0.183
rpl30
-0.031
cab39
0.178
rbp4
-0.030
slc22a4
0.176
si:dkey-42i9.4
-0.030
gaa3-as
0.175
tspan18a
-0.030
CT997819.3
0.171
h1fx
-0.030
si:dkeyp-50b9.1
0.171
rpl7a
-0.030
LOC101883823
0.171
hsp90ab1
-0.030
XLOC-034149
0.169
rps18
-0.030
gipc1
0.169
rpl23a
-0.029
LOC101887081
0.166
rpl34
-0.029
LOC570185
0.166
fxyd1
-0.029
CABZ01065684.1
0.166
cct4
-0.029
ggt1a
0.162
ndufa6
-0.029
si:ch211-264e16.1
0.158
hic1
-0.029
XLOC-029030
0.158
ggt5a
-0.029
si:dkey-31e10.1
0.158
prpf8
-0.029
CU914622.2
0.157
fam50a
-0.028
tgm2l
0.156
palm2
-0.028