Daniocell
vimr2 (eye)
vimentin-related 2
ZFIN
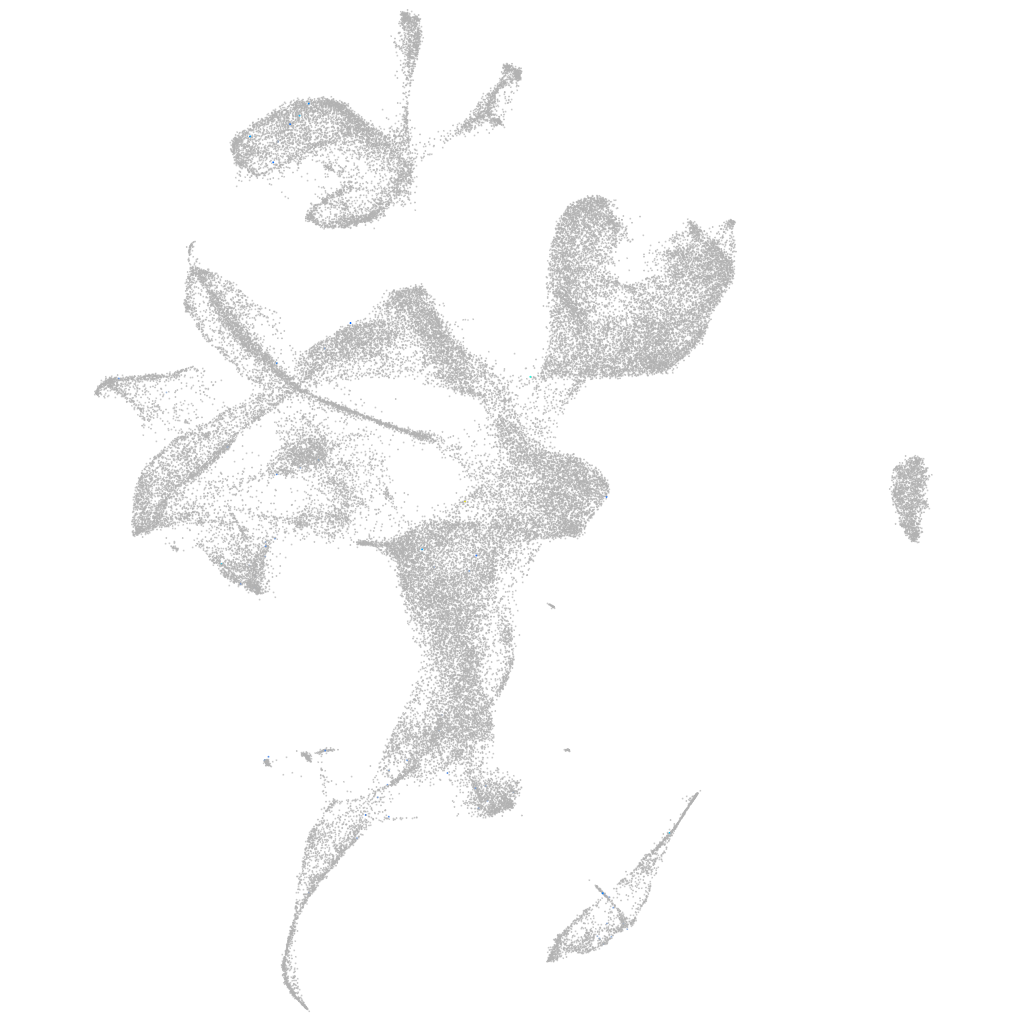
Gene expression UMAP
Display:
Expression
Stage
Other cell groups
all cells
blastomeres
PGCs
endoderm
axial mesoderm
muscle
mural cells /
non-skeletal muscle
mesenchyme
hematopoietic /
vasculature
pronephros
neural
spinal cord / glia
eye
taste / olfactory
otic / lateral line
epidermis
periderm
fin
ionocytes / mucous
pigment cells
Expression by stage/cluster
Correlated gene expression
Positive correlation
Negative correlation
Gene
r
Gene
r
sc:d156
0.270
si:ch73-1a9.3
-0.016
si:dkeyp-3f10.17
0.256
hmgn6
-0.014
XLOC-023769
0.215
six6b
-0.012
LOC108183529
0.195
ptmab
-0.012
CR339041.2
0.135
epb41a
-0.012
XLOC-036926
0.131
cadm3
-0.011
si:ch211-1o7.2
0.128
dlgap5
-0.010
CR382385.1
0.104
pvalb1
-0.010
AL928824.2
0.094
anp32e
-0.010
LOC110439623
0.093
h2afva
-0.010
rin1a
0.081
tbx2b
-0.009
adgrf6
0.078
si:ch211-284e13.6
-0.009
PARD3 (1 of many)
0.075
fkbp1ab
-0.009
si:ch211-132p1.3
0.074
ubc
-0.009
havcr2
0.071
LOC100537384
-0.009
CABZ01067558.1
0.071
gng13b
-0.009
mkxa
0.070
btg1
-0.009
BX465848.2
0.066
cenpf
-0.009
XLOC-044238
0.064
thoc1
-0.009
BX324142.1
0.063
pvalb2
-0.008
col8a1b
0.063
cdca8
-0.008
CABZ01072548.1
0.062
rbm4.2
-0.008
zgc:174653
0.061
ip6k2a
-0.008
fbxo30b
0.059
cotl1
-0.008
tnfrsf11b
0.059
top2a
-0.008
si:dkey-219e21.4
0.057
cyt1
-0.008
eve1
0.057
tp53inp2
-0.008
TCF24
0.055
vsx1
-0.008
LOC101882642
0.054
si:dkey-108k21.10
-0.008
CR391910.2
0.053
lin7a
-0.008
foxa
0.052
si:ch1073-83n3.2
-0.008
gpd1c
0.050
mylpfb
-0.008
layna
0.050
syt5b
-0.008
pgfb
0.049
mdkb
-0.008
tmem154
0.048
mier1a
-0.008