Daniocell
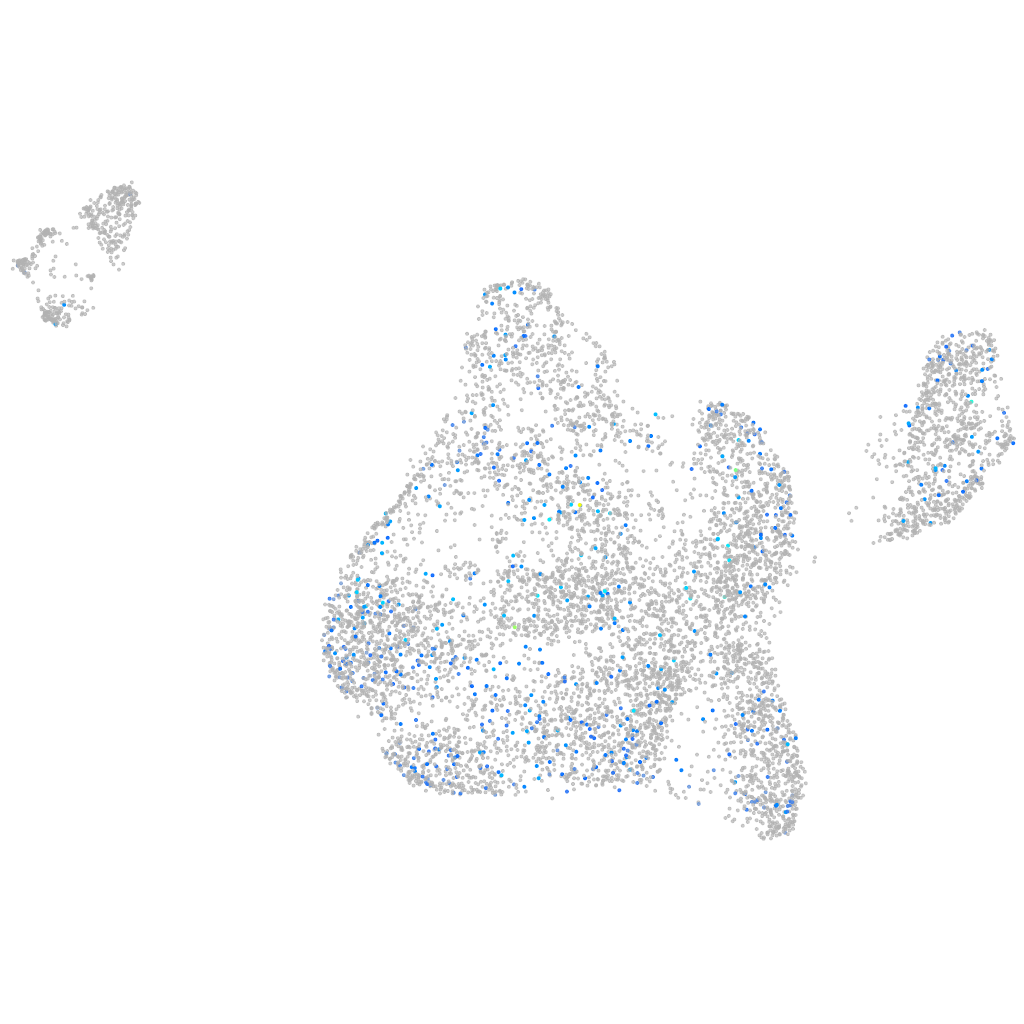
si:dkey-33c14.7 (blastomeres)
si:dkey-33c14.7
ZFIN
Gene expression UMAP
Display:
Expression
Stage
Other cell groups
all cells
blastomeres
PGCs
endoderm
axial mesoderm
muscle
mural cells /
non-skeletal muscle
mesenchyme
hematopoietic /
vasculature
pronephros
neural
spinal cord / glia
eye
taste / olfactory
otic / lateral line
epidermis
periderm
fin
ionocytes / mucous
pigment cells
Expression by stage/cluster
Correlated gene expression
Positive correlation
Negative correlation
Gene
r
Gene
r
tigara
0.079
ska2
-0.050
ugt5a4
0.076
mid1ip1l
-0.049
mir203b
0.074
zgc:113424
-0.047
mcm3
0.073
cth1
-0.046
si:dkeyp-123a12.2
0.072
btg4
-0.046
rps21
0.072
slc25a25a
-0.046
si:dkey-151g10.6
0.072
bokb
-0.045
tmprss9
0.071
h2af1al
-0.044
si:ch211-152c2.3
0.070
zgc:77112
-0.044
rpl14
0.068
si:ch211-199g17.2
-0.044
eef1a1l1
0.067
tob1a
-0.043
rpl36
0.067
fbxo32
-0.043
FP085399.4
0.066
lsm14b
-0.042
pcdh2ab2
0.066
acp5a
-0.042
rps12
0.066
paqr3a
-0.042
hspb1
0.066
FO834825.1
-0.042
rpl32
0.066
gripap1
-0.041
tgfbr3
0.066
slmapb
-0.041
cirbpb
0.065
h1m
-0.041
marcksl1b
0.065
fbxo45
-0.041
rplp0
0.065
slc35f6
-0.041
FP016235.1
0.065
zgc:100951
-0.040
rpl10
0.064
rp2
-0.040
rps6
0.064
dtnbp1a
-0.040
aldob
0.064
apopt1
-0.039
hnrnpa0a
0.063
marveld2a
-0.039
XLOC-030240
0.063
cbx8b
-0.038
rplp1
0.063
si:dkeyp-34c12.1
-0.038
hspe1
0.063
ca15b
-0.038
si:ch211-271d10.2
0.063
NC-002333.4
-0.037
rps3a
0.062
baiap2l1a
-0.037
rpl30
0.062
zgc:56231
-0.037
si:ch73-1a9.3
0.062
ppp1r9alb
-0.037
si:dkeyp-2e4.5
0.061
zp3c
-0.037
LOC101884484
0.061
rbm7
-0.037