Daniocell
si:dkey-33c14.7 (ionocytes / mucous-producing)
si:dkey-33c14.7
ZFIN
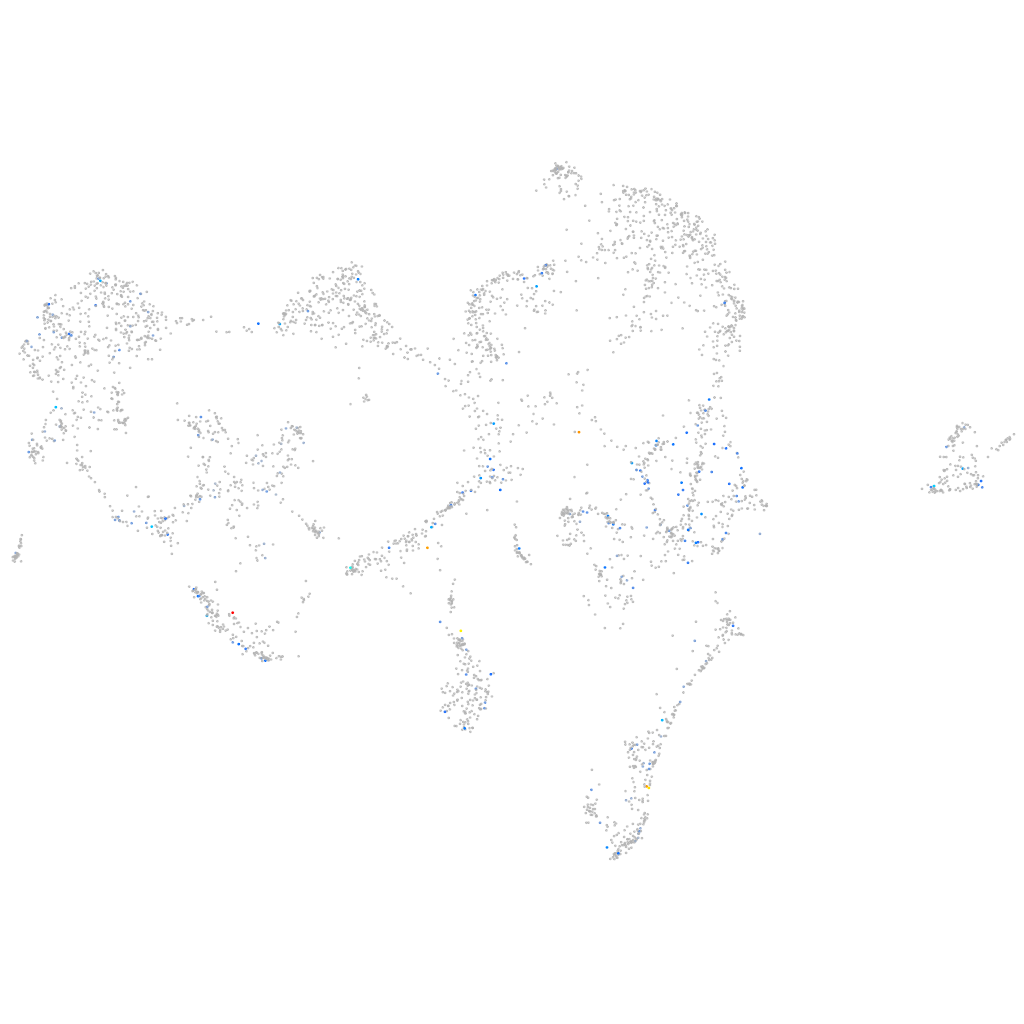
Gene expression UMAP
Display:
Expression
Stage
Other cell groups
all cells
blastomeres
PGCs
endoderm
axial mesoderm
muscle
mural cells /
non-skeletal muscle
mesenchyme
hematopoietic /
vasculature
pronephros
neural
spinal cord / glia
eye
taste / olfactory
otic / lateral line
epidermis
periderm
fin
ionocytes / mucous
pigment cells
Expression by stage/cluster
Correlated gene expression
Positive correlation
Negative correlation
Gene
r
Gene
r
LOC103910194
0.356
tmem59
-0.085
ccdc180
0.283
epcam
-0.085
LOC103908953
0.243
cd63
-0.083
fut11
0.224
selenow1
-0.082
rgs7b
0.209
krt91
-0.079
actl6b
0.208
ier2b
-0.078
rasgrp3
0.198
malb
-0.072
CT990567.2
0.188
krt4
-0.072
st3gal3b
0.180
si:dkey-87o1.2
-0.069
ugt5g1
0.180
zgc:153284
-0.068
TIMM21
0.178
si:dkey-65b12.6
-0.068
tsnax
0.171
arpc3
-0.068
npas1
0.171
lgals3b
-0.067
LOC101882287
0.170
zgc:92481
-0.066
hoxb7a
0.170
muc5.1
-0.066
zgc:158689
0.166
gnb1a
-0.066
wdr47b
0.164
si:ch73-359m17.9
-0.065
si:dkeyp-75b4.9
0.158
si:dkey-193p11.2
-0.065
XLOC-025098
0.156
atp2a3
-0.063
si:ch73-367f21.5
0.154
zgc:101785
-0.063
ift88
0.152
chmp5b
-0.062
XLOC-025107
0.152
cldn23a
-0.062
nppc
0.146
cst14a.2
-0.061
XLOC-044050
0.145
mvp
-0.061
def6a
0.145
rpl14
-0.060
nog2
0.142
pim1
-0.060
fanca
0.139
hdlbpa
-0.060
ltb4r2a
0.133
rplp2
-0.060
fbxl8
0.132
sec23b
-0.060
znf207b
0.131
ccni
-0.060
znf1094
0.129
CABZ01039859.1
-0.059
LOC101885805
0.128
b3gnt7
-0.059
XLOC-020301
0.125
tpd52l2b
-0.059
thbs1a
0.124
stard10
-0.059
si:dkey-66i24.7
0.124
ezrb
-0.058