Daniocell
si:dkey-33c14.7 (taste / olfactory)
si:dkey-33c14.7
ZFIN
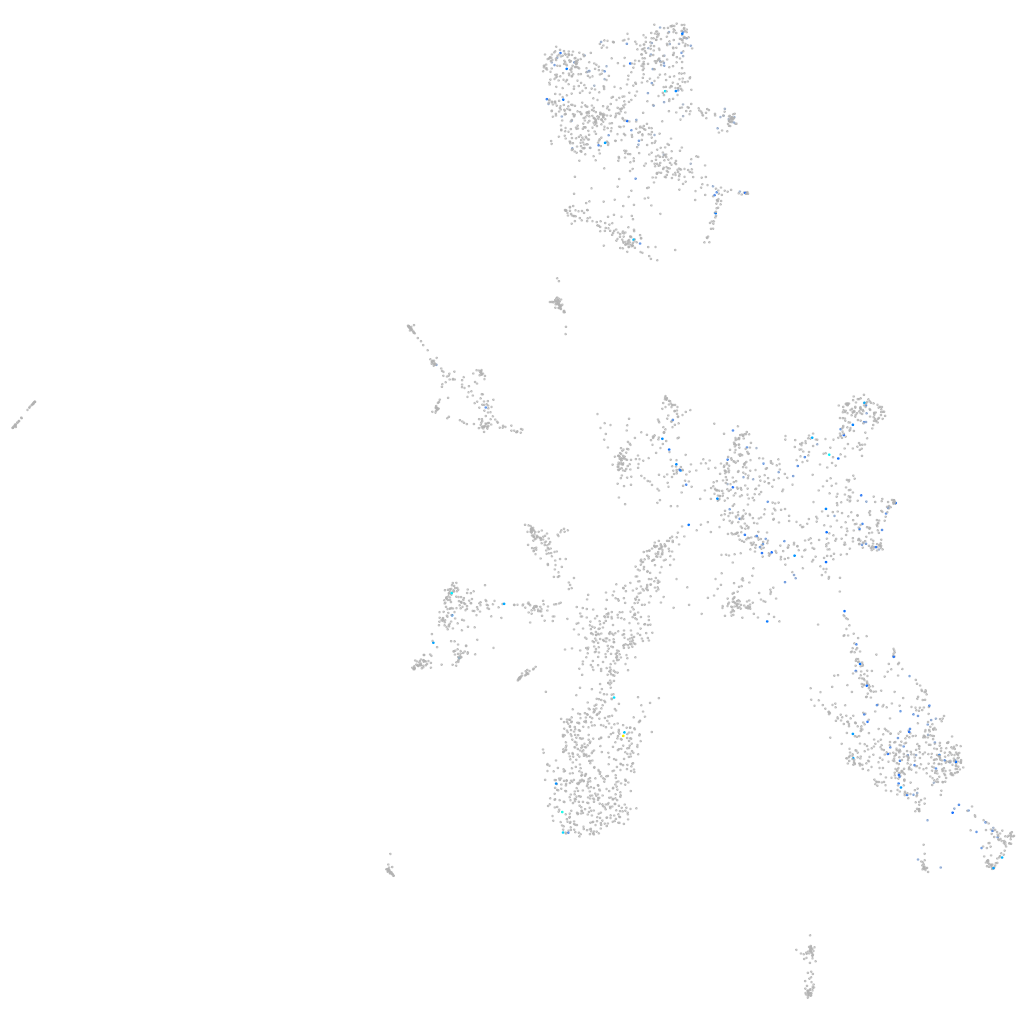
Gene expression UMAP
Display:
Expression
Stage
Other cell groups
all cells
blastomeres
PGCs
endoderm
axial mesoderm
muscle
mural cells /
non-skeletal muscle
mesenchyme
hematopoietic /
vasculature
pronephros
neural
spinal cord / glia
eye
taste / olfactory
otic / lateral line
epidermis
periderm
fin
ionocytes / mucous
pigment cells
Expression by stage/cluster
Correlated gene expression
Positive correlation
Negative correlation
Gene
r
Gene
r
AL645792.2
0.214
insm1a
-0.070
BX663606.1
0.179
atp6v0cb
-0.068
LOC110438679
0.175
stxbp1a
-0.067
CU633999.1
0.170
celf3a
-0.067
CR388373.2
0.166
rtn1a
-0.064
il12a
0.162
appa
-0.063
cpo
0.155
elavl3
-0.062
BX323064.2
0.152
gap43
-0.057
lck
0.151
tmeff1b
-0.057
zmp:0000000906
0.151
kdm6bb
-0.057
LOC110439439
0.145
gng3
-0.055
rida.1
0.145
si:dkey-276j7.1
-0.054
LO018315.7
0.144
CR383676.1
-0.054
FP016239.1
0.142
marcksl1b
-0.054
XLOC-023402
0.136
mllt11
-0.053
LOC103912023
0.130
stmn1b
-0.053
tbc1d10c
0.130
tuba8l3
-0.053
CU459094.1
0.129
ptbp3
-0.053
s100a1
0.128
klf7a
-0.052
XLOC-026839
0.126
mapk8ip2
-0.052
ebi3
0.126
vamp2
-0.052
XLOC-042085
0.124
maptb
-0.052
LOC101882396
0.121
nrxn1a
-0.051
LOC103910395
0.119
ppme1
-0.051
gpr22b
0.118
dpysl3
-0.051
rs1b
0.118
atp6v1g1
-0.051
LOC108182317
0.115
zc4h2
-0.051
XLOC-007509
0.114
tmem59l
-0.050
XLOC-001673
0.113
atp1b2a
-0.050
XLOC-005894
0.111
rab39bb
-0.049
cyp4t8
0.111
slc6a6a
-0.049
BX548024.2
0.111
cpe
-0.049
si:ch73-125k17.2
0.111
camk2n1a
-0.049
mtcl1
0.111
oaz1b
-0.049
znf1055
0.110
ap1s1
-0.048