Daniocell
si:dkey-33c14.7 (pigment cells)
si:dkey-33c14.7
ZFIN
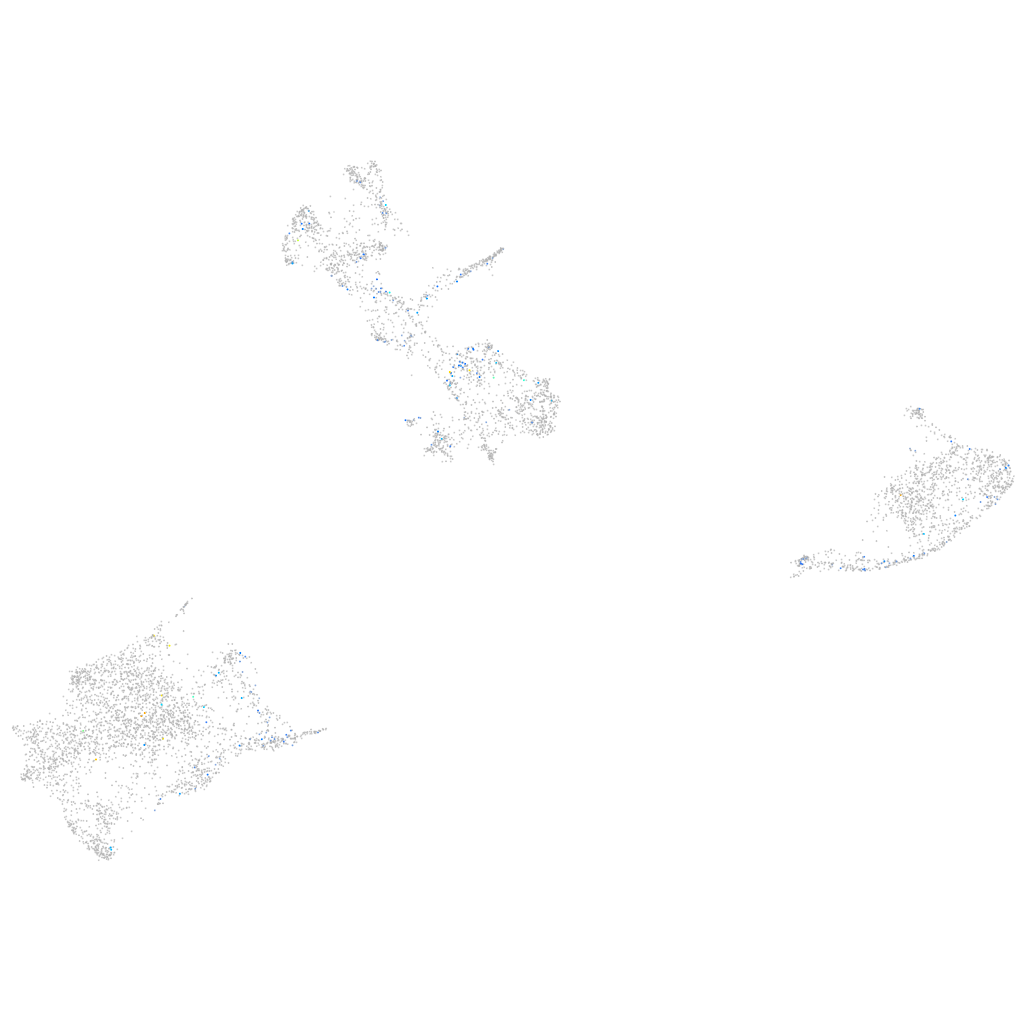
Gene expression UMAP
Display:
Expression
Stage
Other cell groups
all cells
blastomeres
PGCs
endoderm
axial mesoderm
muscle
mural cells /
non-skeletal muscle
mesenchyme
hematopoietic /
vasculature
pronephros
neural
spinal cord / glia
eye
taste / olfactory
otic / lateral line
epidermis
periderm
fin
ionocytes / mucous
pigment cells
Expression by stage/cluster
Correlated gene expression
Positive correlation
Negative correlation
Gene
r
Gene
r
cfap61
0.217
pvalb2
-0.056
FP325123.2
0.188
rtn1b
-0.050
LOC108190733
0.177
krt8
-0.048
tmem121b
0.137
slc22a7a
-0.046
BX510949.1
0.135
uraha
-0.044
BX957318.1
0.133
s100a10b
-0.044
BX936397.2
0.131
actb2
-0.044
XLOC-009558
0.131
zgc:110339
-0.043
si:dkey-58f6.2
0.125
si:dkey-251i10.2
-0.040
espl1
0.124
csrp2
-0.040
agpat9l
0.122
tnni2a.4
-0.039
LOC108180204
0.121
pvalb1
-0.039
LOC100329358
0.119
cd63
-0.038
slx4ip
0.117
mylpfa
-0.037
CU972512.1
0.115
prdx5
-0.036
LOC101884357
0.115
oacyl
-0.036
si:dkey-242g16.2
0.114
nupr1a
-0.035
hgfa
0.112
icn
-0.035
si:ch73-368j24.10
0.112
hbbe1.2
-0.034
XLOC-028772
0.111
gstp1
-0.034
pm20d1.1
0.108
aqp3a
-0.034
fen1
0.105
LOC110437731
-0.034
pcna
0.104
si:ch211-251b21.1
-0.034
LRP4
0.102
apoa2
-0.033
CR925768.1
0.102
mylz3
-0.033
FO904870.1
0.102
marcksl1b
-0.033
pparda
0.102
tmem130
-0.033
XLOC-003984
0.100
gch2
-0.032
ctslb
0.100
myhz1.1
-0.031
si:ch211-194m7.3
0.099
LOC101886030
-0.031
dre-let-7g-1
0.098
hbbe1.3
-0.030
dut
0.098
agmo
-0.030
si:ch211-189k9.2
0.097
cotl1
-0.030
si:dkey-283j8.1
0.096
CABZ01021592.1
-0.030
rpa2
0.096
asip2b
-0.029