Daniocell
si:dkey-33c14.7 (fin)
si:dkey-33c14.7
ZFIN
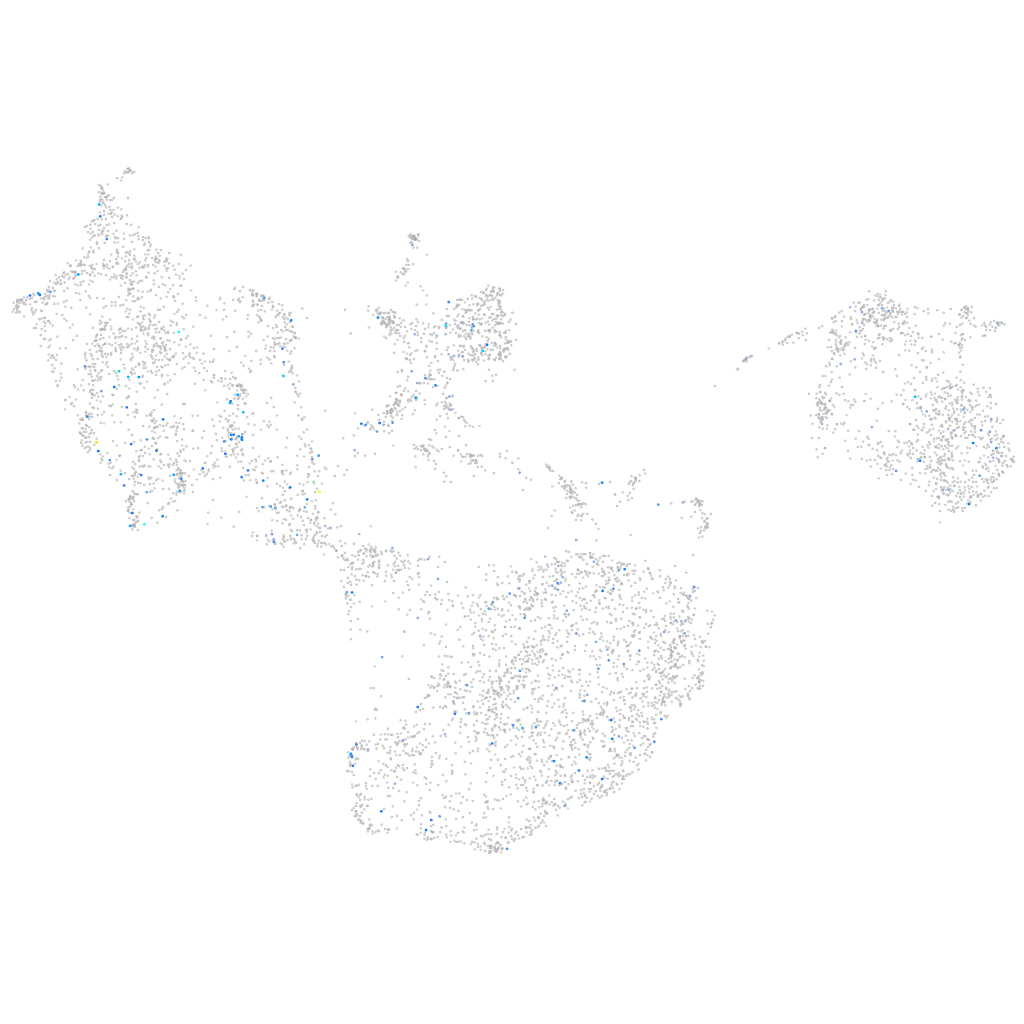
Gene expression UMAP
Display:
Expression
Stage
Other cell groups
all cells
blastomeres
PGCs
endoderm
axial mesoderm
muscle
mural cells /
non-skeletal muscle
mesenchyme
hematopoietic /
vasculature
pronephros
neural
spinal cord / glia
eye
taste / olfactory
otic / lateral line
epidermis
periderm
fin
ionocytes / mucous
pigment cells
Expression by stage/cluster
Correlated gene expression
Positive correlation
Negative correlation
Gene
r
Gene
r
LOC103909382
0.204
rbp4
-0.060
znf974
0.158
aqp3a
-0.053
znf1057
0.155
and2
-0.053
LOC101884267
0.155
tmsb1
-0.051
znf1089
0.152
pvalb2
-0.050
LOC103908740
0.138
cebpb
-0.050
slc1a8b
0.138
pfn1
-0.050
gabrb1
0.136
cyt1
-0.049
CR931782.2
0.130
krt4
-0.049
smcr8b
0.129
actb2
-0.047
LOC108190755
0.128
cfl1l
-0.047
LOC108184012
0.128
lxn
-0.045
XLOC-036508
0.122
actc1b
-0.044
BX005153.2
0.122
anxa1a
-0.044
BX664721.3
0.121
tmsb4x
-0.044
XLOC-019753
0.116
wu:fb18f06
-0.044
LOC101882396
0.115
cldn1
-0.043
si:ch73-262h23.4
0.114
cebpd
-0.043
pimr186
0.113
cldni
-0.041
XLOC-034272
0.113
icn
-0.041
si:dkey-27l15.1
0.111
pvalb1
-0.041
si:ch211-205a14.3
0.111
cotl1
-0.040
LOC108182290
0.111
epcam
-0.040
CR759846.1
0.109
and3
-0.039
or115-5
0.106
epgn
-0.039
GPR68
0.104
fmodb
-0.038
BX649434.1
0.104
apoa2
-0.038
si:dkey-58f10.10
0.102
si:ch1073-406l10.2
-0.038
rnf32
0.101
s100a10b
-0.038
kcnk12l
0.101
krt5
-0.038
LOC103911742
0.099
capns1a
-0.038
BX323087.2
0.099
si:rp71-77l1.1
-0.037
znf1030
0.098
cyt1l
-0.037
LOC570526
0.098
myl12.1
-0.037
zgc:172341
0.097
si:dkey-248g15.3
-0.037