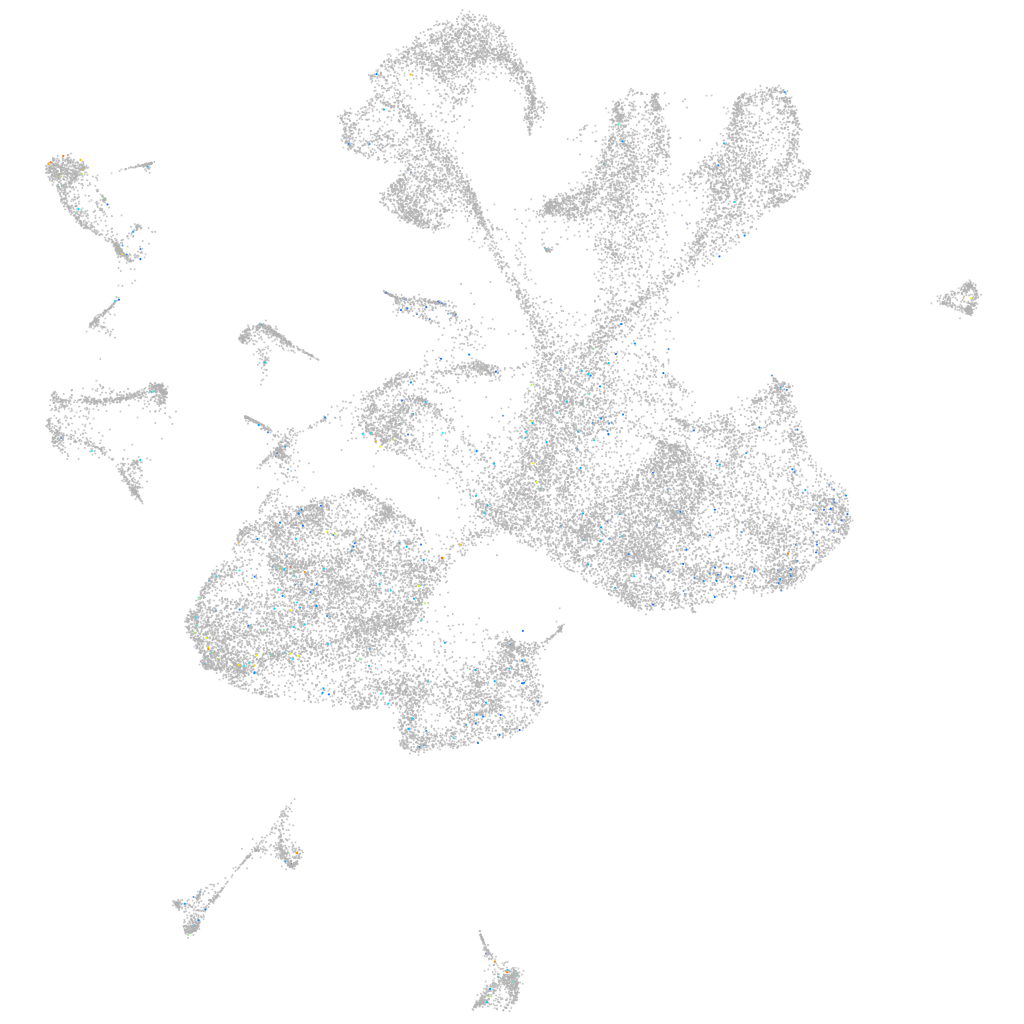
Daniocell
si:dkey-16j16.4 (glial cells / spinal cord)
si:dkey-16j16.4
ZFIN
Gene expression UMAP
Display:
Expression
Stage
Other cell groups
all cells
blastomeres
PGCs
endoderm
axial mesoderm
muscle
mural cells /
non-skeletal muscle
mesenchyme
hematopoietic /
vasculature
pronephros
neural
spinal cord / glia
eye
taste / olfactory
otic / lateral line
epidermis
periderm
fin
ionocytes / mucous
pigment cells
Expression by stage/cluster
Correlated gene expression
Positive correlation
Negative correlation
Gene
r
Gene
r
si:ch211-119c20.2
0.096
si:ch73-1a9.3
-0.045
BX510992.2
0.094
h3f3d
-0.041
LOC108184031
0.091
tubb2b
-0.039
FO704810.1
0.086
ptmab
-0.038
BX004970.1
0.077
hnrnpaba
-0.035
si:dkey-217m5.8
0.069
cirbpa
-0.035
LOC108191721
0.068
si:ch211-288g17.3
-0.035
CABZ01073834.1
0.066
elavl3
-0.035
BX323861.3
0.063
hmgn6
-0.033
CR376774.1
0.063
marcksb
-0.033
XLOC-043097
0.062
hmga1a
-0.033
CR589947.3
0.061
cirbpb
-0.031
slc2a5
0.058
hnrnpa0b
-0.031
LOC110439553
0.057
fkbp1aa
-0.031
CR848759.1
0.056
hmgn2
-0.031
LOC100536643
0.056
h3f3a
-0.031
lrit2
0.056
khdrbs1a
-0.031
si:ch211-288g17.4
0.055
zc4h2
-0.031
ccbe1
0.054
h2afvb
-0.030
si:ch73-151m17.5
0.054
tuba1a
-0.029
hsd17b2
0.051
si:ch211-222l21.1
-0.029
XLOC-027304
0.051
tuba1c
-0.029
si:ch211-5k11.8
0.051
nono
-0.029
zgc:194007
0.051
alyref
-0.029
CR388055.1
0.050
si:dkey-276j7.1
-0.028
sh2d5
0.050
srsf9
-0.028
zgc:174888
0.049
rpl38
-0.028
zgc:195212
0.049
tmsb
-0.028
cebpd
0.049
hmgb1b
-0.028
XLOC-005647
0.049
nucks1a
-0.028
trnC
0.049
rps3
-0.027
si:ch211-266g18.9
0.048
rps12
-0.027
si:ch211-151h10.2
0.048
zfhx3
-0.027
LOC110439743
0.048
rps29
-0.027
pomcb
0.047
ptmaa
-0.027