Daniocell
si:dkey-16j16.4 (ionocytes / mucous-producing)
si:dkey-16j16.4
ZFIN
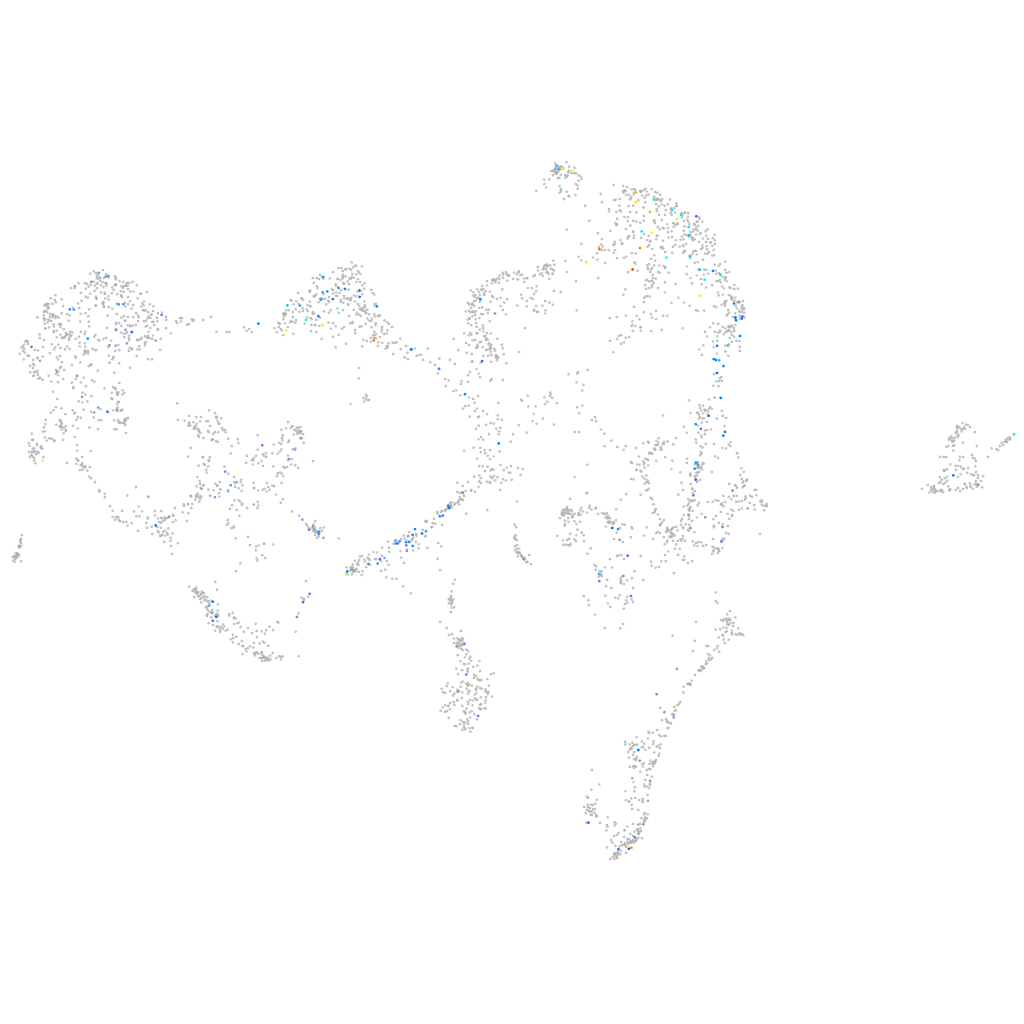
Gene expression UMAP
Display:
Expression
Stage
Other cell groups
all cells
blastomeres
PGCs
endoderm
axial mesoderm
muscle
mural cells /
non-skeletal muscle
mesenchyme
hematopoietic /
vasculature
pronephros
neural
spinal cord / glia
eye
taste / olfactory
otic / lateral line
epidermis
periderm
fin
ionocytes / mucous
pigment cells
Expression by stage/cluster
Correlated gene expression
Positive correlation
Negative correlation
Gene
r
Gene
r
si:ch1073-100f3.2
0.219
ran
-0.087
LOC101882916
0.186
actb2
-0.084
BX571712.3
0.182
si:ch73-1a9.3
-0.083
CT573282.1
0.182
hspe1
-0.081
BX248331.2
0.170
khdrbs1a
-0.077
sgsm1a
0.169
COX5B
-0.075
si:dkey-40c23.2
0.168
c1qbp
-0.074
CR388129.1
0.160
cct5
-0.073
adra2c
0.160
h2afvb
-0.072
si:ch73-158p21.2
0.159
wu:fb55g09
-0.071
CABZ01072487.2
0.157
rpl35a
-0.071
si:ch211-198m17.1
0.155
nkap
-0.070
klf12b
0.151
atp5mc3b
-0.069
zgc:162182
0.150
snrpd1
-0.067
si:ch1073-376c22.1
0.143
si:ch211-222l21.1
-0.067
LOC110437991
0.142
id1
-0.066
tagapb
0.141
nhp2
-0.065
ahrra
0.140
atp1b1a
-0.065
BX000701.1
0.135
ube2ib
-0.065
CR847531.1
0.132
dynll1
-0.065
lmod3
0.131
cap1
-0.065
rab3db
0.129
cops7a
-0.065
FP236157.1
0.129
hnrnpabb
-0.065
tgm2l
0.129
seta
-0.065
LOC110439496
0.128
atp5f1c
-0.065
phactr1
0.128
eif3f
-0.064
kita
0.127
eif3k
-0.064
XLOC-021400
0.126
nop58
-0.064
LOC110439808
0.126
hmgn6
-0.064
LOC100331480
0.125
atp5if1a
-0.063
si:ch1073-178p5.3
0.125
syncrip
-0.063
LOC103911635
0.125
uqcrh
-0.063
zgc:113274
0.123
psma3
-0.063
lrrc32
0.123
rps7
-0.063
tmem125b
0.122
zgc:56493
-0.063