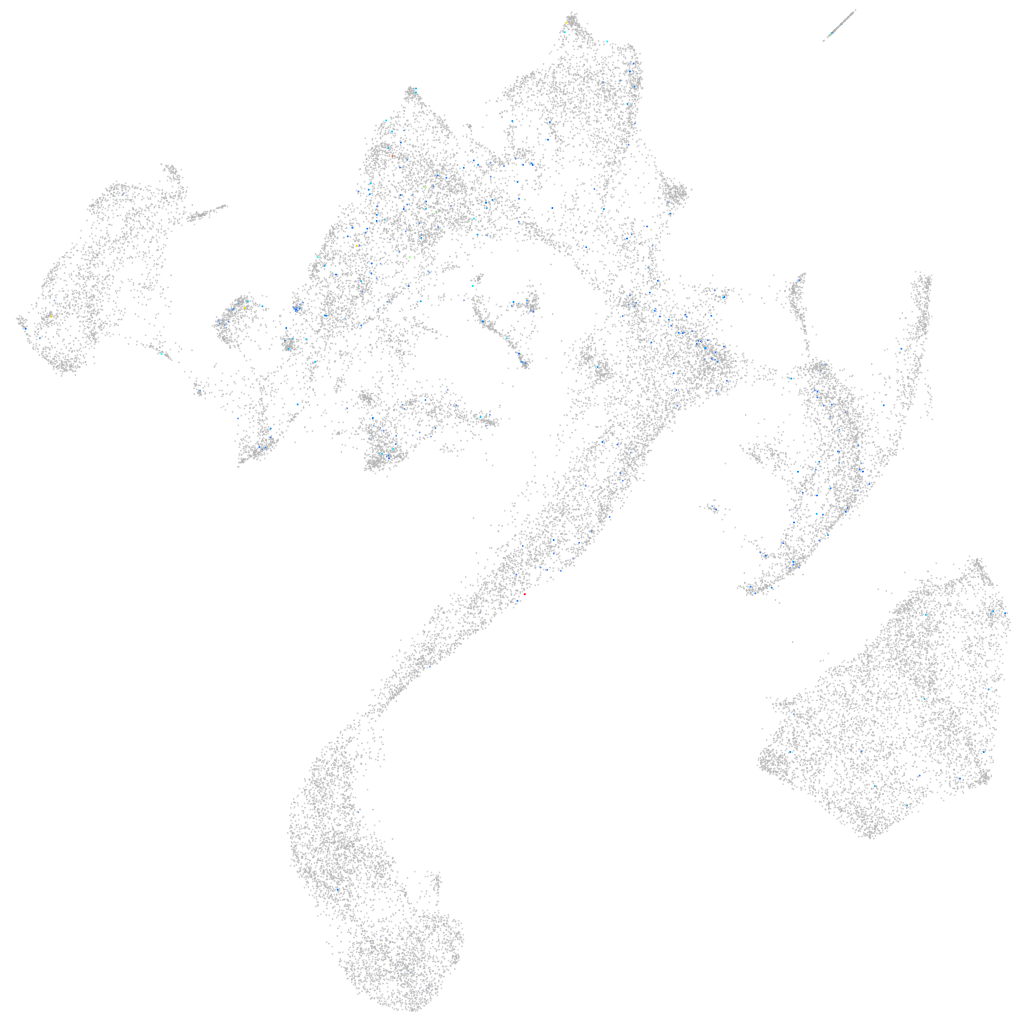
Daniocell
si:dkey-16j16.4 (muscle)
si:dkey-16j16.4
ZFIN
Gene expression UMAP
Display:
Expression
Stage
Other cell groups
all cells
blastomeres
PGCs
endoderm
axial mesoderm
muscle
mural cells /
non-skeletal muscle
mesenchyme
hematopoietic /
vasculature
pronephros
neural
spinal cord / glia
eye
taste / olfactory
otic / lateral line
epidermis
periderm
fin
ionocytes / mucous
pigment cells
Expression by stage/cluster
Correlated gene expression
Positive correlation
Negative correlation
Gene
r
Gene
r
sod3a
0.174
tnnc2
-0.037
XLOC-007906
0.167
neb
-0.036
LOC101885528.1
0.125
gapdh
-0.036
CT990567.2
0.121
ckmb
-0.036
si:ch211-181d7.1
0.120
ak1
-0.036
BX649485.1
0.098
actn3a
-0.035
LOC101882910
0.097
tmem38a
-0.035
CR383662.3
0.095
tpma
-0.035
abr
0.095
acta1b
-0.035
si:ch211-143l19.3
0.091
actc1b
-0.035
LOC101882962
0.090
ldb3b
-0.034
pcdh1g3
0.090
aldoab
-0.034
wu:fa56d06
0.089
tmem182a
-0.034
crfb15
0.088
actn3b
-0.034
si:ch73-367f21.6
0.086
tmod4
-0.033
dre-let-7g-1
0.086
fxr2
-0.033
zgc:77938
0.082
CABZ01078594.1
-0.033
XLOC-042037
0.081
ckma
-0.032
CR925728.1
0.081
casq2
-0.032
neurod6a
0.080
cav3
-0.032
slc44a4
0.079
XLOC-005350
-0.032
BX548060.1
0.078
acta1a
-0.031
atp1a1a.3
0.076
XLOC-001975
-0.031
si:dkey-201c13.2
0.074
myoz1b
-0.030
irge1
0.070
sh3bgr
-0.030
pip4p1b
0.070
desma
-0.030
si:ch73-18b11.2
0.069
mybphb
-0.030
CR626886.2
0.068
XLOC-006515
-0.030
BX004785.1
0.067
hspb1
-0.030
taar20t
0.067
srl
-0.030
zgc:174180
0.065
tnnt3a
-0.030
BX890543.1
0.064
XLOC-025819
-0.030
si:ch211-102c2.4
0.064
sar1ab
-0.030
CR450687.1
0.063
myl1
-0.029
si:ch211-25g7.5
0.063
txlnbb
-0.029