Daniocell
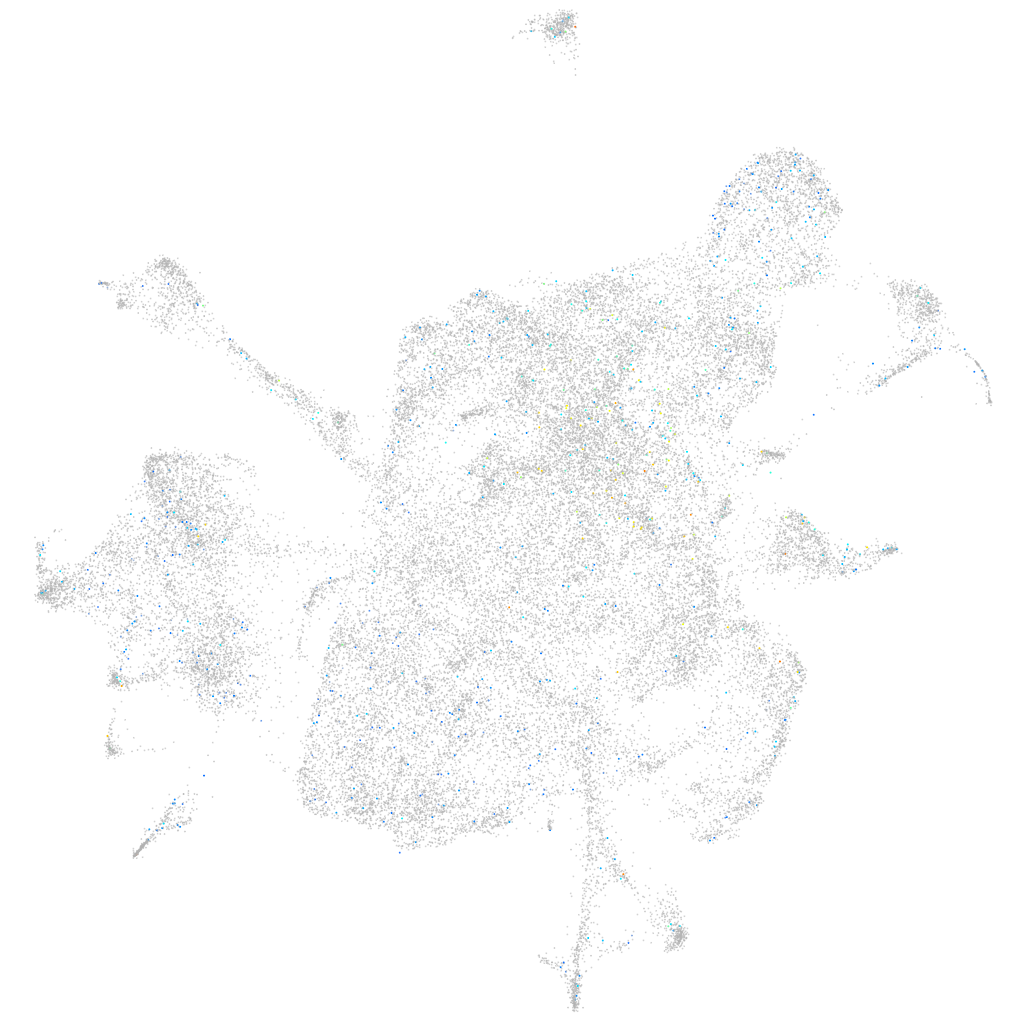
si:dkey-16j16.4 (mesenchyme)
si:dkey-16j16.4
ZFIN
Gene expression UMAP
Display:
Expression
Stage
Other cell groups
all cells
blastomeres
PGCs
endoderm
axial mesoderm
muscle
mural cells /
non-skeletal muscle
mesenchyme
hematopoietic /
vasculature
pronephros
neural
spinal cord / glia
eye
taste / olfactory
otic / lateral line
epidermis
periderm
fin
ionocytes / mucous
pigment cells
Expression by stage/cluster
Correlated gene expression
Positive correlation
Negative correlation
Gene
r
Gene
r
LOC110438137
0.085
hmga1a
-0.035
LOC110439009
0.067
si:dkey-151g10.6
-0.034
si:ch211-66i15.5
0.059
rpl38
-0.031
XLOC-007275
0.058
rps29
-0.031
CT009597.1
0.054
rplp2l
-0.028
LOC101882257.1
0.051
rpl29
-0.028
XLOC-035243
0.050
hmgn2
-0.028
BX248410.2
0.048
tma7
-0.028
LOC570079
0.047
rps28
-0.028
LOC110438044
0.047
si:ch211-222l21.1
-0.027
gpr174
0.046
si:ch73-1a9.3
-0.027
XLOC-043794
0.044
hmgb2b
-0.027
tob1b
0.043
h2afvb
-0.025
ier2b
0.042
hmgb3a
-0.025
mir338-2
0.042
rpl37
-0.025
cldn23b
0.042
pabpc1a
-0.024
dmc1
0.041
khdrbs1a
-0.023
CR383676.1
0.041
tubb2b
-0.023
loxa
0.041
ddx39ab
-0.023
loxl3a
0.040
rpl39
-0.023
btg2
0.040
snrpb
-0.023
BX005461.2
0.040
apex1
-0.023
si:dkey-78k11.4
0.039
cfl1
-0.022
ftr22
0.039
snrpf
-0.022
LOC108191789
0.038
nucks1a
-0.022
jdp2b
0.038
hnrnpa0a
-0.021
cebpd
0.038
psma5
-0.021
cav2
0.038
hmgb2a
-0.021
si:ch73-6k14.2
0.038
snrpe
-0.020
LOC103911332
0.037
sae1
-0.020
LOC103910614
0.037
tomm6
-0.020
oatx
0.037
cbx3a
-0.020
zgc:162730
0.036
rpl36a
-0.020
BX936298.1
0.036
hmgn6
-0.020
eef1da
0.036
hnrnpa0b
-0.020