Daniocell
si:dkey-16j16.4 (mural cells / non-skeletal muscle)
si:dkey-16j16.4
ZFIN
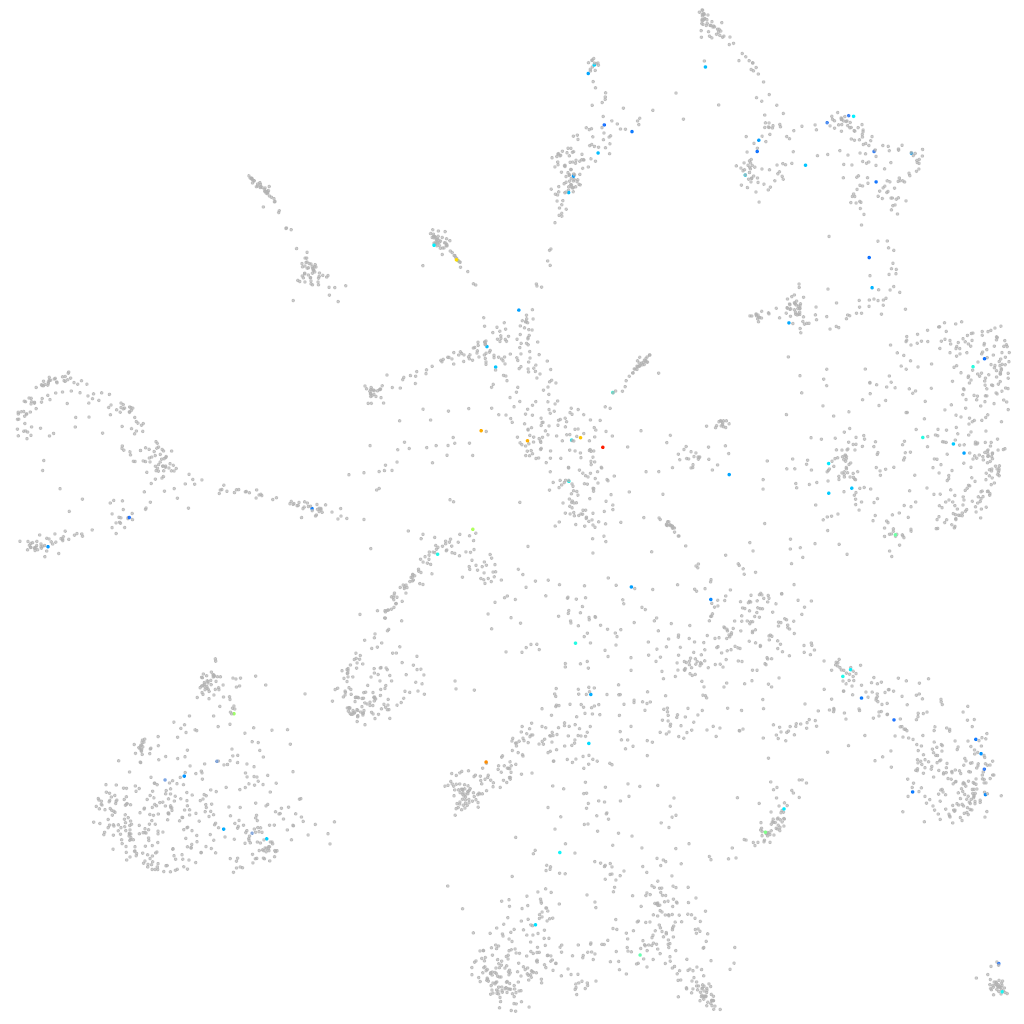
Gene expression UMAP
Display:
Expression
Stage
Other cell groups
all cells
blastomeres
PGCs
endoderm
axial mesoderm
muscle
mural cells /
non-skeletal muscle
mesenchyme
hematopoietic /
vasculature
pronephros
neural
spinal cord / glia
eye
taste / olfactory
otic / lateral line
epidermis
periderm
fin
ionocytes / mucous
pigment cells
Expression by stage/cluster
Correlated gene expression
Positive correlation
Negative correlation
Gene
r
Gene
r
BX511018.2
0.290
rps3a
-0.062
si:ch73-93k15.5
0.225
naa10
-0.054
si:ch211-171h4.7
0.215
foxf2a
-0.054
zp3a.2
0.192
ckba
-0.052
si:ch211-93f2.1
0.179
hapln1a
-0.051
FP102192.2
0.178
psma6a
-0.050
XLOC-012427
0.175
ckbb
-0.049
MFAP4 (1 of many)
0.163
rps10
-0.048
si:dkey-187j14.4
0.156
cald1b
-0.048
gpr182
0.146
ntn5
-0.048
LOC100535033
0.145
atp5f1c
-0.047
si:dkey-109a10.2
0.144
mylkb
-0.046
LOC101886572
0.141
p4hb
-0.046
XLOC-024231
0.141
dynlrb1
-0.046
HIST2H3A
0.139
ppiab
-0.046
si:ch73-233m11.2
0.138
cox6a1
-0.045
slc26a6
0.137
BX323087.1
-0.045
zbbx
0.136
foxf1
-0.045
LOC103910840
0.135
foxp4
-0.045
clcn1b
0.134
si:ch211-62a1.3
-0.045
si:ch211-168b3.2
0.134
hint1
-0.044
slc7a14a
0.134
cox5ab
-0.044
LOC108181107
0.133
cdc42ep3
-0.044
proca
0.132
rpl18
-0.043
pak7
0.132
mab21l2
-0.042
si:ch73-206d17.1
0.131
tmem198b
-0.042
LOC103911092
0.130
dad1
-0.042
LOC100004499
0.130
h2afx1
-0.041
LOC103909239
0.129
inhbaa
-0.041
si:dkey-81j8.6
0.129
atp5mc1
-0.041
taar18d
0.127
desmb
-0.041
adgb
0.126
acta1a
-0.041
c6ast3
0.126
rpl10
-0.040
mdh1b
0.126
snrpd3l
-0.040
CR356222.1
0.122
ptmab
-0.040