Daniocell
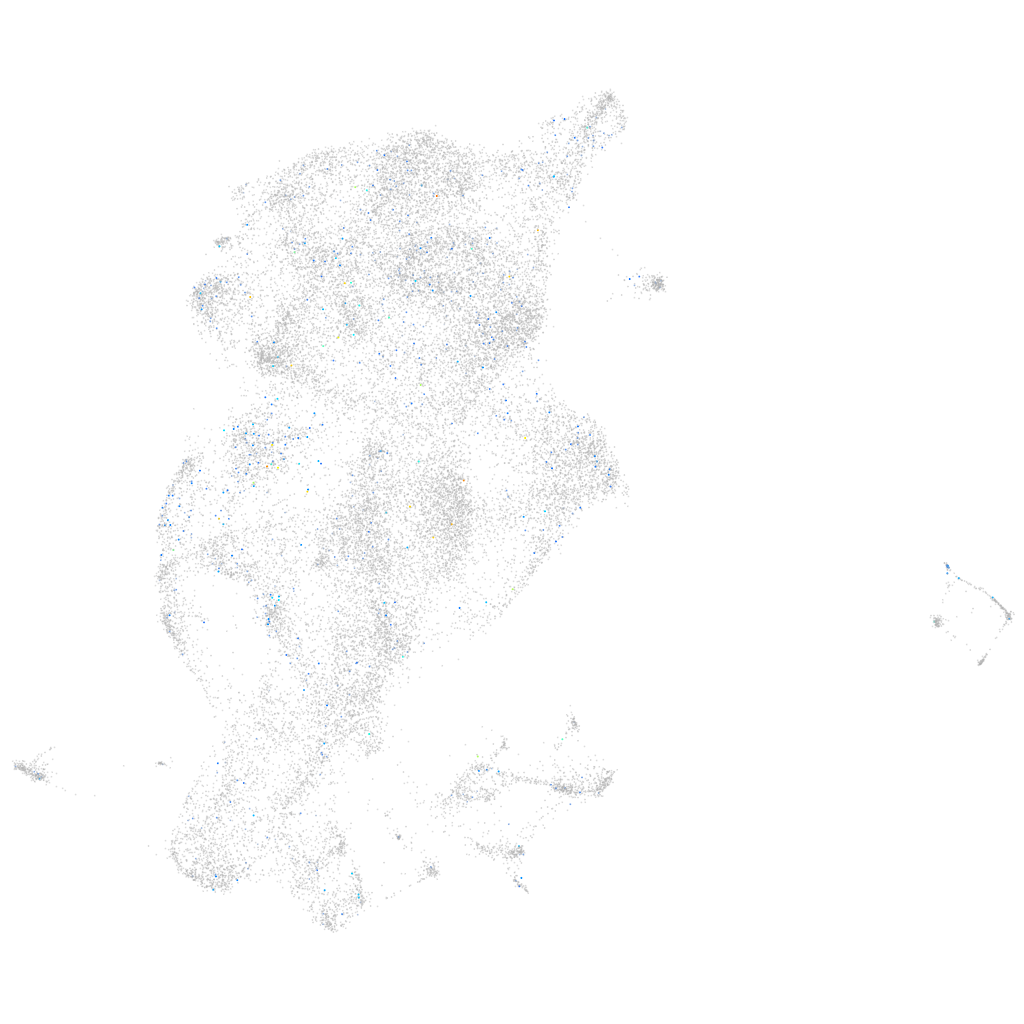
si:dkey-16j16.4 (periderm)
si:dkey-16j16.4
ZFIN
Gene expression UMAP
Display:
Expression
Stage
Other cell groups
all cells
blastomeres
PGCs
endoderm
axial mesoderm
muscle
mural cells /
non-skeletal muscle
mesenchyme
hematopoietic /
vasculature
pronephros
neural
spinal cord / glia
eye
taste / olfactory
otic / lateral line
epidermis
periderm
fin
ionocytes / mucous
pigment cells
Expression by stage/cluster
Correlated gene expression
Positive correlation
Negative correlation
Gene
r
Gene
r
CU633479.1
0.111
krt4
-0.056
LOC100331067
0.104
cyt1
-0.044
LOC110438837
0.098
s100a10b
-0.041
XLOC-042596
0.090
si:ch211-195b11.3
-0.041
LOC110438280
0.089
si:ch211-157c3.4
-0.040
XLOC-019038
0.085
cyt1l
-0.040
BX248113.1
0.083
krt5
-0.037
muc13b
0.082
rpl39
-0.036
FP102921.1
0.080
krt17
-0.036
c16h7orf31
0.079
s100w
-0.035
LOC100003040
0.079
rpl29
-0.034
lrrc7
0.078
faua
-0.033
prlh2
0.077
anxa2a
-0.033
si:dkey-260g12.1
0.074
rps12
-0.033
eps8b
0.074
rps15a
-0.033
si:dkey-92f12.2
0.071
si:dkey-16p21.8
-0.032
zgc:174944
0.070
zgc:193505
-0.032
hlcs
0.067
gsta.1
-0.032
thegl
0.064
rpl8
-0.032
mdga1
0.064
cfl1l
-0.031
si:dkey-239b22.2
0.064
icn
-0.029
GABRR1
0.062
smdt1b
-0.029
BX004970.1
0.061
wu:fb18f06
-0.028
muc13a
0.060
rps29
-0.028
slc35f3a
0.060
anxa1c
-0.027
ticrr
0.060
rpl22
-0.026
LOC100334612
0.059
CR854839.1
-0.026
rela
0.059
rpl19
-0.026
si:ch211-227e10.2
0.059
rpl21
-0.026
BX546499.2
0.058
rps20
-0.026
c1ql3b
0.057
s100v1
-0.026
si:dkey-9l20.3
0.057
cyp2y3
-0.025
mt-cyb
0.057
icn2
-0.025
lim2.1
0.056
rpl35
-0.025
LOC108190819
0.056
anxa1a
-0.025