Daniocell
si:ch73-112l6.1 (neural)
si:ch73-112l6.1
ZFIN
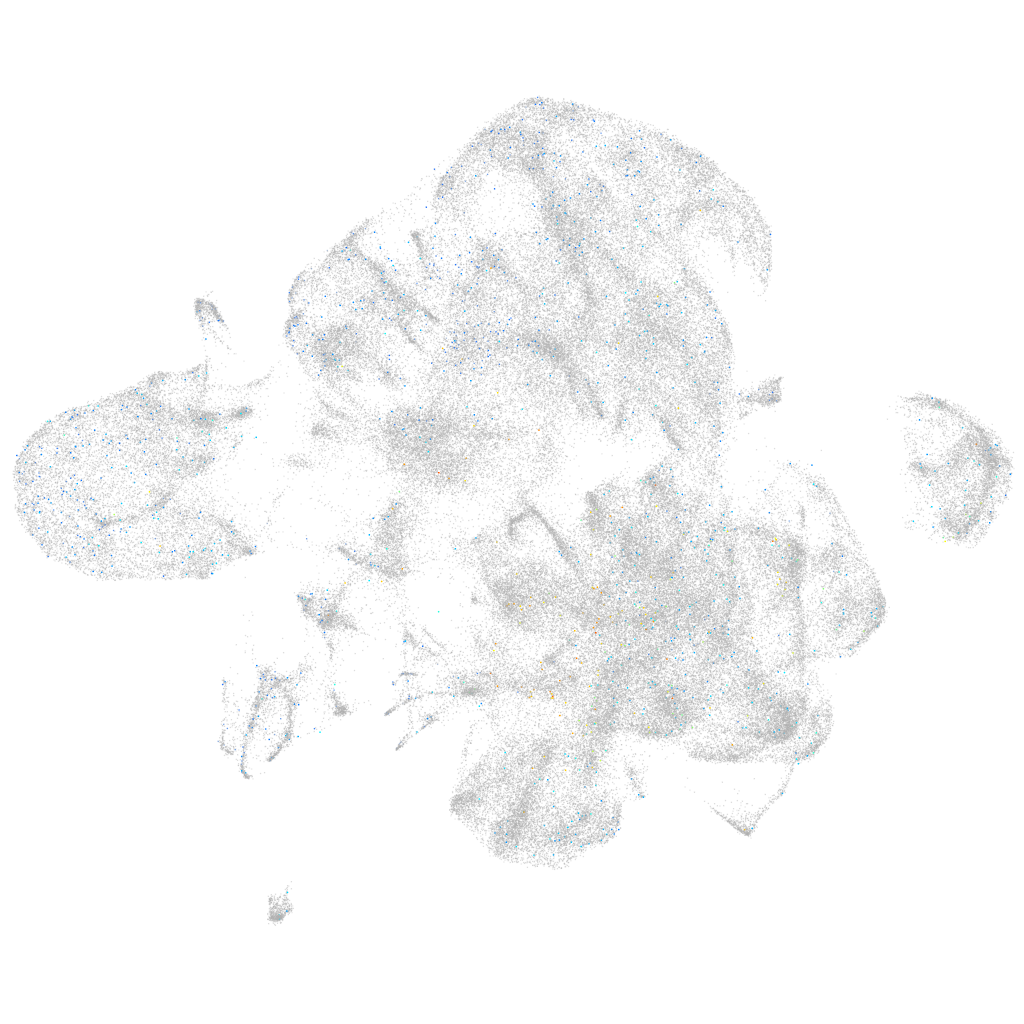
Gene expression UMAP
Display:
Expression
Stage
Other cell groups
all cells
blastomeres
PGCs
endoderm
axial mesoderm
muscle
mural cells /
non-skeletal muscle
mesenchyme
hematopoietic /
vasculature
pronephros
neural
spinal cord / glia
eye
taste / olfactory
otic / lateral line
epidermis
periderm
fin
ionocytes / mucous
pigment cells
Expression by stage/cluster
Correlated gene expression
Positive correlation
Negative correlation
Gene
r
Gene
r
ponzr10
0.056
ptmab
-0.024
unm-sa911
0.043
hnrnpa0l
-0.022
AL928866.2
0.041
si:ch211-222l21.1
-0.020
si:ch73-22a13.3
0.039
h3f3a
-0.020
AL928650.1
0.036
rpl28
-0.019
clic6
0.035
hnrnpa0b
-0.019
LOC797799
0.034
rps7
-0.019
baiap2l2a
0.034
zgc:114188
-0.018
si:ch211-76m11.5
0.033
rps29
-0.018
POLR2E
0.032
rpl13a
-0.018
or106-8
0.030
hmgb2b
-0.018
CABZ01038493.1
0.029
rps28
-0.017
XLOC-004682
0.029
rps15a
-0.017
XLOC-026454
0.029
ybx1
-0.017
slc26a3.1
0.028
rpl39
-0.017
si:dkey-61f9.1
0.027
rplp2l
-0.017
XLOC-000490
0.027
faua
-0.017
klhdc2
0.027
rps9
-0.017
kcnf1a
0.027
sumo3a
-0.016
antxr1a
0.026
rps17
-0.016
si:dkeyp-110c12.3
0.025
rpl23
-0.016
gdnfb
0.025
si:dkey-151g10.6
-0.016
LOC101886030
0.025
actb2
-0.016
ccr12b.2
0.024
rps8a
-0.016
itln2
0.024
fabp3
-0.016
BX469925.2
0.024
tubb2b
-0.016
LO018422.1
0.023
rpl37
-0.016
XLOC-042085
0.023
hsp90ab1
-0.016
usp21
0.023
rpl24
-0.016
LOC110439537
0.022
cct5
-0.015
LOC110440139
0.022
rps12
-0.015
si:dkey-83f18.2
0.022
dlb
-0.015
ddit3
0.022
hmgn2
-0.015
plcl2
0.022
psmb7
-0.015
NAT16
0.022
rpl13
-0.015