Daniocell
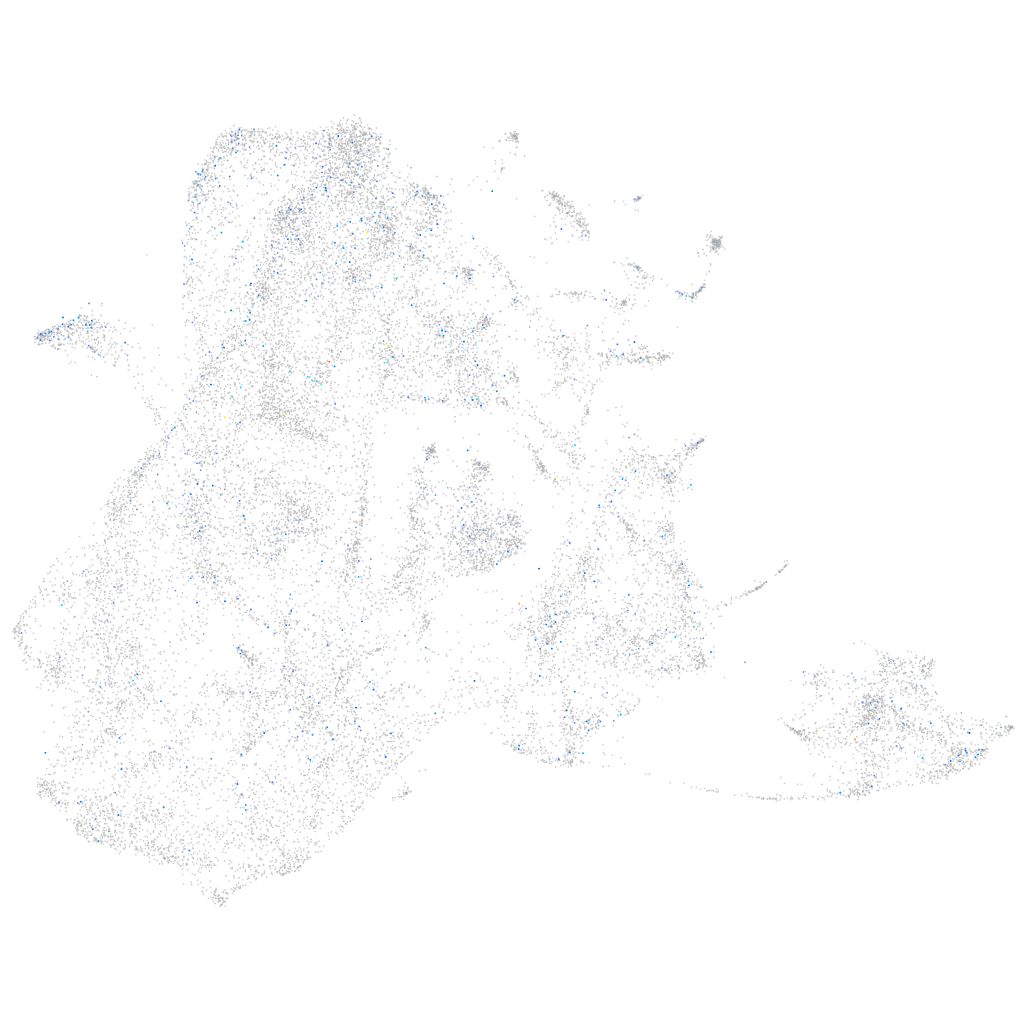
si:ch73-112l6.1 (epidermis)
si:ch73-112l6.1
ZFIN
Gene expression UMAP
Display:
Expression
Stage
Other cell groups
all cells
blastomeres
PGCs
endoderm
axial mesoderm
muscle
mural cells /
non-skeletal muscle
mesenchyme
hematopoietic /
vasculature
pronephros
neural
spinal cord / glia
eye
taste / olfactory
otic / lateral line
epidermis
periderm
fin
ionocytes / mucous
pigment cells
Expression by stage/cluster
Correlated gene expression
Positive correlation
Negative correlation
Gene
r
Gene
r
cand2
0.131
hmgn6
-0.048
XLOC-017492
0.090
si:ch73-281n10.2
-0.043
CR762470.1
0.083
hmgn2
-0.042
zgc:100951
0.081
ptmab
-0.041
LOC110438016
0.077
ostc
-0.041
BX005392.3
0.075
si:ch211-222l21.1
-0.040
LOC110439973
0.074
h2afvb
-0.040
LO017820.1
0.072
myl6
-0.040
LOC101886468
0.071
marcksl1b
-0.040
si:ch211-63b16.3
0.071
tpm4a
-0.040
FO834828.1
0.070
ssr3
-0.039
CABZ01024848.1
0.069
arf5
-0.037
LOC101883472
0.067
dad1
-0.037
XLOC-026673
0.066
ssr4
-0.037
LOC101882771
0.066
sec61b
-0.036
XLOC-021253
0.065
h3f3a
-0.036
CU459186.2
0.063
rbm8a
-0.036
LOC110438332
0.062
hmga1a
-0.035
LOC101884966
0.059
selenof
-0.035
CU469104.1
0.059
mdka
-0.035
LOC100331417
0.057
cnn2
-0.035
ddr2b
0.057
pabpc1a
-0.035
crtac1b
0.057
fkbp11
-0.034
CU468917.1
0.057
snrpb
-0.034
SPHK1
0.056
si:ch73-1a9.3
-0.034
ahcy
0.056
srp19
-0.034
epn3b
0.055
krtcap2
-0.034
LOC108183685
0.054
nid2a
-0.034
ccdc151
0.053
BX927258.1
-0.033
si:ch211-119c20.2
0.053
cdc42l
-0.033
krt91
0.052
ptges3b
-0.033
ncoa1
0.052
srsf3b
-0.033
mgarp
0.052
hspb1
-0.033
CT990561.2
0.051
eny2
-0.033
eef1da
0.051
zgc:174938
-0.033