Daniocell
si:ch73-112l6.1 (mesenchyme)
si:ch73-112l6.1
ZFIN
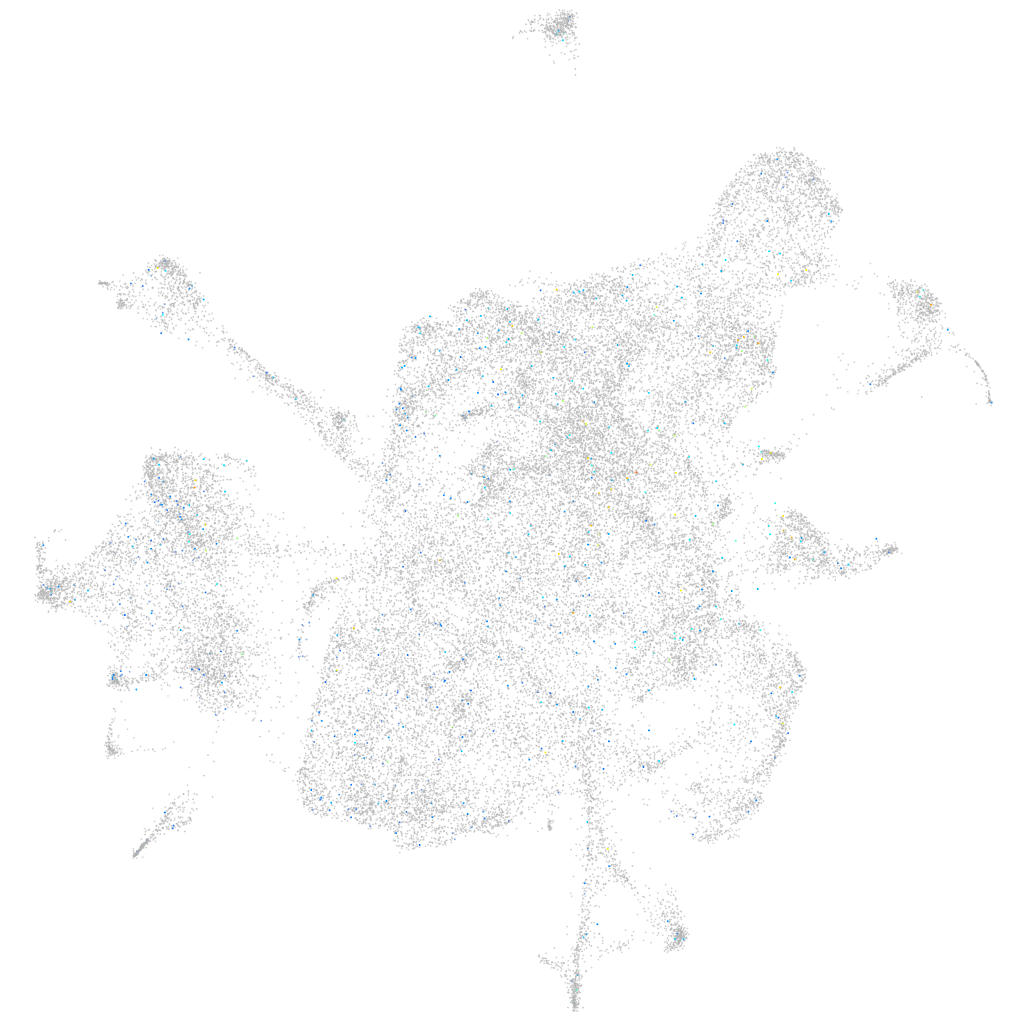
Gene expression UMAP
Display:
Expression
Stage
Other cell groups
all cells
blastomeres
PGCs
endoderm
axial mesoderm
muscle
mural cells /
non-skeletal muscle
mesenchyme
hematopoietic /
vasculature
pronephros
neural
spinal cord / glia
eye
taste / olfactory
otic / lateral line
epidermis
periderm
fin
ionocytes / mucous
pigment cells
Expression by stage/cluster
Correlated gene expression
Positive correlation
Negative correlation
Gene
r
Gene
r
LOC108182912.1
0.100
ssr3
-0.019
si:ch211-255a21.2
0.080
ptges3b
-0.018
RF00324
0.068
rpl21
-0.017
taar14h
0.068
rpl28
-0.016
BX294110.2
0.063
arpc3
-0.015
BX649448.3
0.063
p3h1
-0.015
zmynd12
0.056
rab5if
-0.015
AL954861.2
0.053
hacd3
-0.015
LOC101885530
0.053
rcn1
-0.015
LOC101886293
0.052
uqcrfs1
-0.015
SERPINB8 (1 of many)
0.052
fkbp11
-0.015
si:dkey-208k4.2
0.046
aldoaa
-0.014
CR354538.1
0.045
tbca
-0.014
LOC101887092
0.044
rps12
-0.014
nlrc8
0.044
abcf1
-0.014
LOC108183344
0.043
rpl38
-0.014
CU929360.1
0.043
rplp2l
-0.013
LOC108179626
0.043
snrpd2
-0.013
BX005461.2
0.043
reep3b
-0.013
CABZ01088308.1
0.043
si:ch73-281n10.2
-0.013
pimr133
0.042
ppil1
-0.013
opn1mw3
0.042
ssr4
-0.013
or108-3
0.041
h3f3a
-0.013
si:dkey-92i15.4
0.040
uchl3
-0.013
CU986306.1
0.040
dnajc9
-0.013
CU182823.1
0.040
mrpl20
-0.013
BX545917.1
0.040
rpl35
-0.013
si:ch73-90k17.1
0.039
nup50
-0.013
RF01241
0.039
ube2ib
-0.013
si:ch211-137j23.6
0.038
rpl13a
-0.013
si:ch211-277c7.6
0.037
sec61b
-0.013
LOC100333844
0.037
mcfd2
-0.013
btr24
0.037
tia1l
-0.013
CR792453.2
0.036
stx18
-0.013
kctd16a
0.036
slc39a7
-0.012