Daniocell
si:ch73-112l6.1 (taste / olfactory)
si:ch73-112l6.1
ZFIN
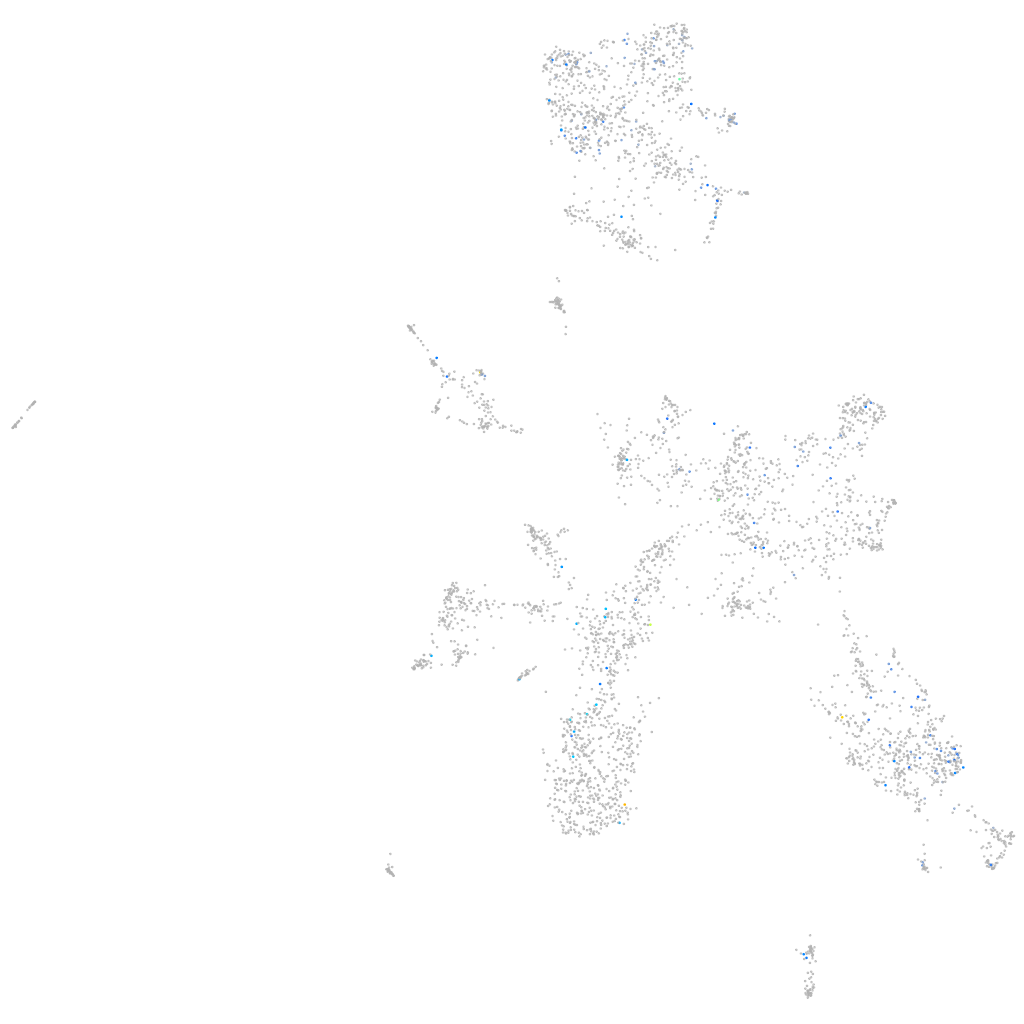
Gene expression UMAP
Display:
Expression
Stage
Other cell groups
all cells
blastomeres
PGCs
endoderm
axial mesoderm
muscle
mural cells /
non-skeletal muscle
mesenchyme
hematopoietic /
vasculature
pronephros
neural
spinal cord / glia
eye
taste / olfactory
otic / lateral line
epidermis
periderm
fin
ionocytes / mucous
pigment cells
Expression by stage/cluster
Correlated gene expression
Positive correlation
Negative correlation
Gene
r
Gene
r
si:ch211-191a16.5
0.269
CU467822.1
-0.043
LOC100001908
0.248
ebf2
-0.038
itgae.1
0.233
dlx4b
-0.038
si:ch211-238e22.5
0.222
eif6
-0.037
si:ch211-8c17.2
0.200
prmt1
-0.037
si:ch211-202h22.10
0.199
timm10
-0.037
rin3
0.193
naa40
-0.036
LOC103911635
0.183
isg20
-0.036
XLOC-023447
0.181
lsm6
-0.035
CU571315.2
0.172
tsr2
-0.035
mir96
0.171
fezf1
-0.035
si:dkeyp-98a7.4
0.167
mbd1b
-0.035
herc4
0.166
ewsr1a
-0.034
si:ch211-137j23.6
0.165
zgc:109986
-0.033
LOC108180722
0.160
CABZ01072614.1
-0.033
kcnmb2
0.156
eif2b1
-0.033
opn1mw2
0.154
timm23a
-0.033
XLOC-043400
0.153
thoc6
-0.032
LOC108179520
0.149
si:ch211-147d7.5
-0.032
chrd
0.143
entpd4
-0.032
il17c
0.142
vamp4
-0.032
crygm2d5
0.139
zgc:56304
-0.032
fbxo41
0.137
ctnnbip1
-0.032
stmn3
0.134
ubc
-0.032
BX005328.1
0.131
nucks1a
-0.031
si:dkey-172k15.6
0.131
mrpl36
-0.031
htr5ab
0.128
aif1l
-0.031
KCNIP1
0.128
tdrd3
-0.031
taar19h
0.127
si:ch211-86h15.1
-0.031
otos
0.127
psmc2
-0.031
opn6a
0.126
spsb4a
-0.031
xkr6a
0.125
zgc:113348
-0.031
fstl3
0.124
ubap2a
-0.030
si:dkeyp-4c4.1
0.123
mcrip1
-0.030
elovl5
0.120
sae1
-0.030