Daniocell
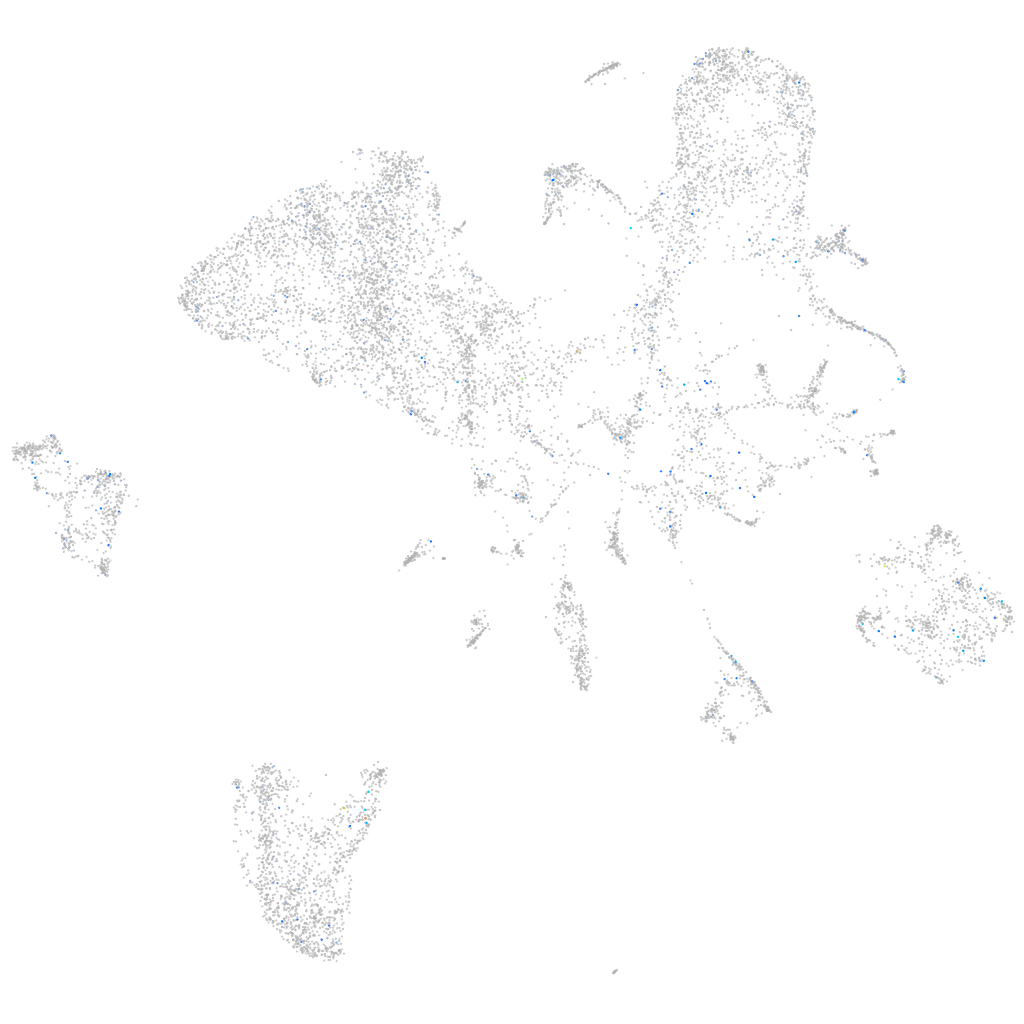
si:ch73-112l6.1 (endoderm)
si:ch73-112l6.1
ZFIN
Gene expression UMAP
Display:
Expression
Stage
Other cell groups
all cells
blastomeres
PGCs
endoderm
axial mesoderm
muscle
mural cells /
non-skeletal muscle
mesenchyme
hematopoietic /
vasculature
pronephros
neural
spinal cord / glia
eye
taste / olfactory
otic / lateral line
epidermis
periderm
fin
ionocytes / mucous
pigment cells
Expression by stage/cluster
Correlated gene expression
Positive correlation
Negative correlation
Gene
r
Gene
r
crygm2d3
0.164
gamt
-0.042
XLOC-023808
0.155
gpx4a
-0.035
BX927181.2
0.153
vdac3
-0.033
LOC103910166
0.150
ahcy
-0.033
BX901918.1
0.136
bhmt
-0.032
ca15c
0.129
apoa1b
-0.032
si:ch211-155o21.3
0.128
apoc2
-0.032
sgk494b
0.126
tpi1b
-0.032
prdm14
0.125
scp2a
-0.031
si:ch73-24k9.2
0.124
mpc1
-0.030
si:ch73-158p21.3
0.116
suclg1
-0.029
LOC110438343
0.114
apoa4b.1
-0.029
CR293531.1
0.109
hao1
-0.028
ankmy1
0.107
mdh1aa
-0.028
hrh2a
0.105
afp4
-0.028
BX324146.1
0.102
apoa2
-0.028
hbaa2
0.100
grhprb
-0.027
enpp5
0.100
cdo1
-0.027
LOC103909765
0.098
fbp1b
-0.027
LOC110439785
0.094
gapdh
-0.026
sh3bgr
0.094
shmt1
-0.026
acod1
0.092
agxta
-0.026
LOC108184005
0.089
lgals2b
-0.026
pcdh1g2
0.089
si:ch211-270n8.1
-0.025
LO017793.1
0.087
zgc:123103
-0.025
fam69c
0.085
hoga1
-0.025
FP102806.1
0.085
zgc:92744
-0.025
LOC101885915
0.084
serpina1
-0.025
ksr1a
0.084
mrps14
-0.025
si:dkey-23a13.2
0.082
atp6v1g1
-0.025
sebox
0.082
tfa
-0.025
LOC103910269
0.081
slc25a20
-0.025
or106-11
0.081
pcbd1
-0.025
LOC100007492
0.081
rltgr
-0.025
LOC103911723
0.079
apoa1a
-0.025