Daniocell
si:ch73-112l6.1 (glial cells / spinal cord)
si:ch73-112l6.1
ZFIN
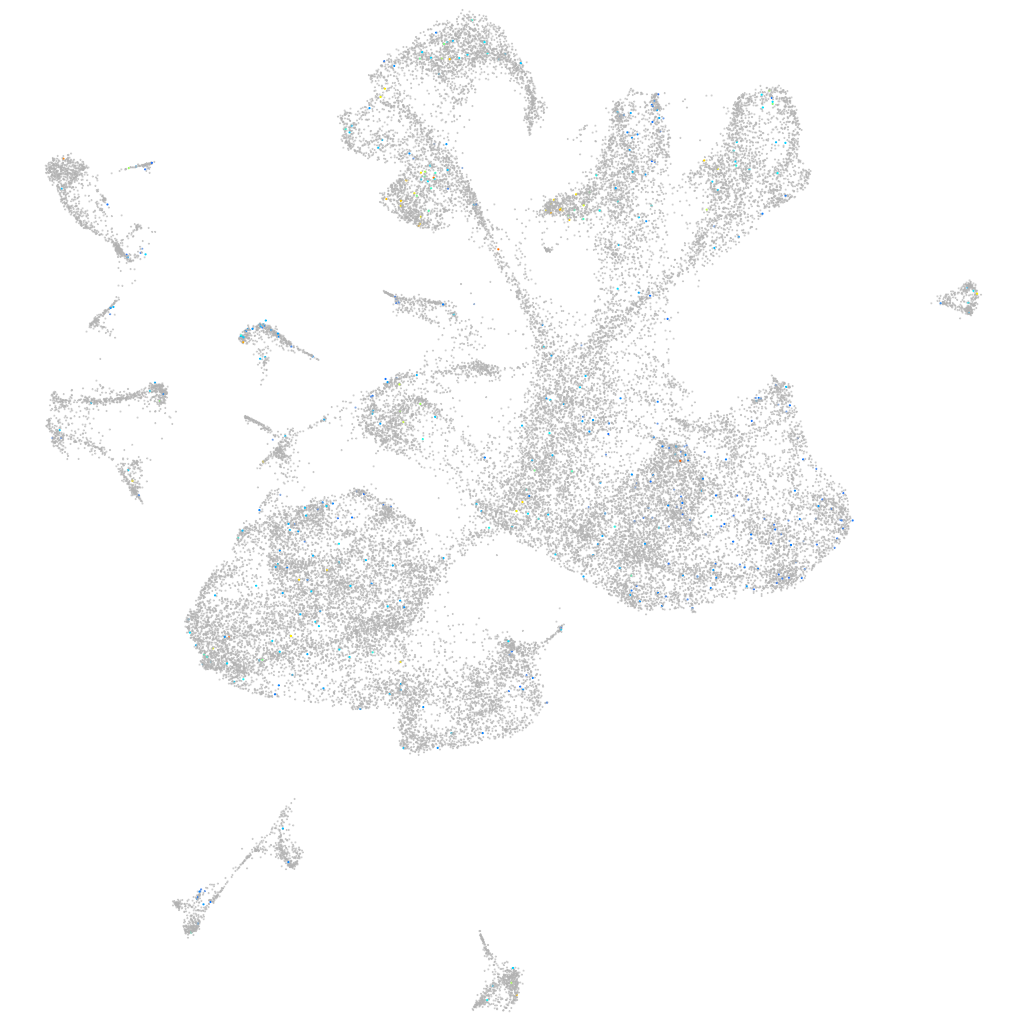
Gene expression UMAP
Display:
Expression
Stage
Other cell groups
all cells
blastomeres
PGCs
endoderm
axial mesoderm
muscle
mural cells /
non-skeletal muscle
mesenchyme
hematopoietic /
vasculature
pronephros
neural
spinal cord / glia
eye
taste / olfactory
otic / lateral line
epidermis
periderm
fin
ionocytes / mucous
pigment cells
Expression by stage/cluster
Correlated gene expression
Positive correlation
Negative correlation
Gene
r
Gene
r
hbaa2
0.085
rpl39
-0.039
LOC100329433
0.083
rpl35
-0.038
taf4b
0.070
rps26
-0.034
XLOC-039714
0.068
her15.1
-0.033
CU570769.3
0.068
rps15a
-0.033
BX545917.6
0.060
slc25a3b
-0.032
LOC103910884
0.059
rps7
-0.031
LOC100535869
0.058
rps13
-0.031
CR974461.1
0.056
rbx1
-0.031
dnajc22
0.055
hnrnpabb
-0.030
or132-1
0.055
rps17
-0.030
zgc:171424
0.054
rps15
-0.030
BX548075.3
0.054
rpl7
-0.030
p2rx8
0.053
ssr3
-0.030
znf1182
0.053
actb2
-0.030
CU570889.1
0.052
snrpf
-0.030
si:dkey-148a17.6
0.049
eef1a1l1
-0.029
LOC101882805
0.048
tma7
-0.029
phc3
0.048
rpl23
-0.029
CABZ01112050.1
0.046
rpl11
-0.029
gpa33b
0.046
rps28
-0.029
zgc:195077
0.046
hmgb2b
-0.029
LOC101886433
0.046
rpsa
-0.029
vps54
0.045
si:dkey-151g10.6
-0.029
XLOC-043919
0.045
XLOC-003690
-0.029
aire
0.045
XLOC-003692
-0.029
CT997819.3
0.044
rps24
-0.028
CT030153.1
0.044
eef1b2
-0.028
zgc:195212
0.043
snrpb
-0.028
pimr70
0.043
rpl8
-0.028
LOC101883236
0.043
rpl35a
-0.028
gcm2
0.042
alyref
-0.028
si:dkey-12h9.6
0.042
rpl26
-0.028
CU639412.1
0.041
rpl12
-0.028
BX005308.1
0.041
ilf2
-0.028