Daniocell
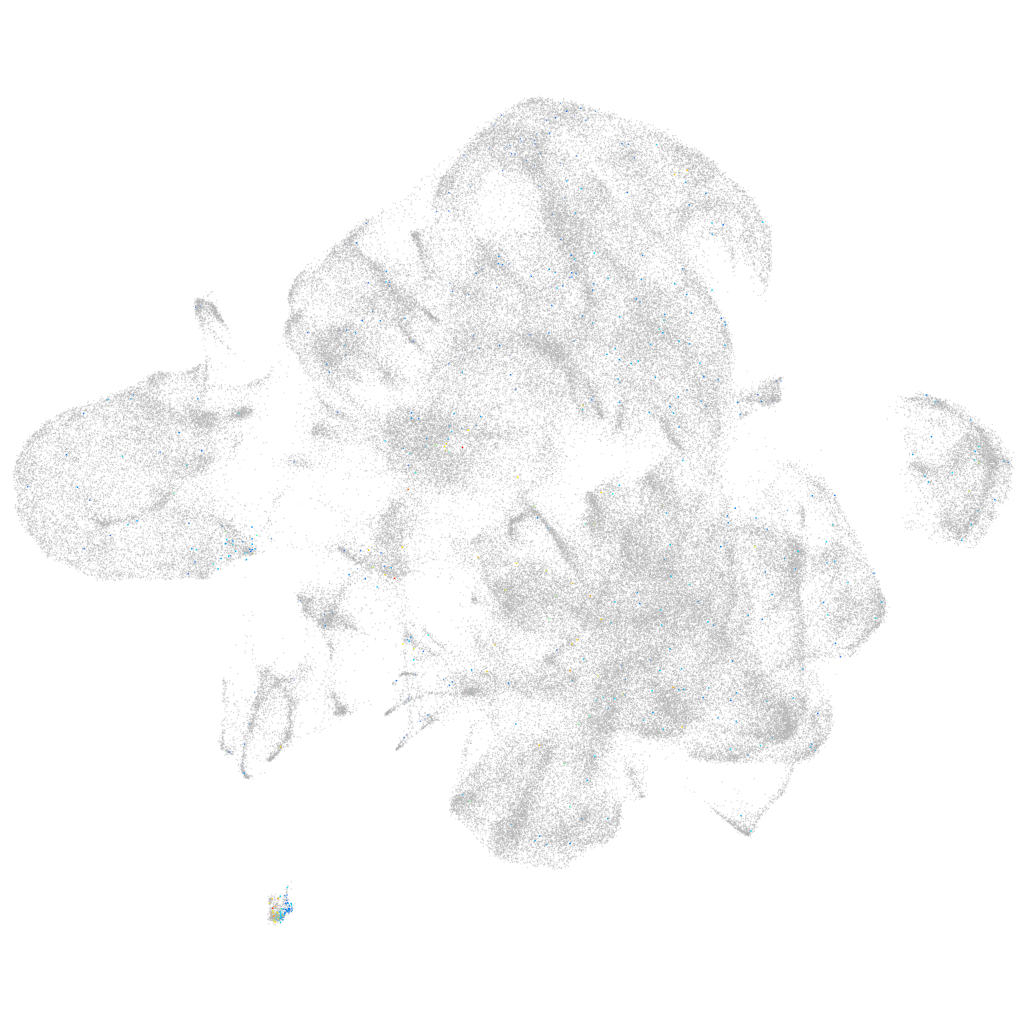
si:ch211-207e14.4 (neural)
si:ch211-207e14.4
ZFIN
Gene expression UMAP
Display:
Expression
Stage
Other cell groups
all cells
blastomeres
PGCs
endoderm
axial mesoderm
muscle
mural cells /
non-skeletal muscle
mesenchyme
hematopoietic /
vasculature
pronephros
neural
spinal cord / glia
eye
taste / olfactory
otic / lateral line
epidermis
periderm
fin
ionocytes / mucous
pigment cells
Expression by stage/cluster
Correlated gene expression
Positive correlation
Negative correlation
Gene
r
Gene
r
grp
0.150
marcksl1b
-0.026
cldnh
0.147
tuba1c
-0.025
CR759836.1
0.141
si:ch211-222l21.1
-0.024
prr15la
0.140
khdrbs1a
-0.024
itpr3
0.138
hmgn6
-0.023
gfral
0.138
hnrnpabb
-0.023
bik
0.135
nova2
-0.023
zgc:92380
0.131
hmgb1b
-0.022
plcd1a
0.129
hnrnpa0b
-0.021
si:ch211-130m23.2
0.127
hnrnpaba
-0.020
pou2f3
0.126
si:dkey-56m19.5
-0.020
CABZ01073083.1
0.126
si:ch73-1a9.3
-0.020
gcnt7
0.123
marcksb
-0.020
pvalb8
0.122
tmsb4x
-0.020
si:ch211-202h22.8
0.121
si:dkey-276j7.1
-0.020
vill
0.117
si:ch211-288g17.3
-0.020
ponzr5
0.117
cfl1
-0.019
si:ch211-256e16.4
0.115
marcksl1a
-0.019
si:ch211-79k12.1
0.109
tubb2b
-0.018
hopx
0.109
ran
-0.018
b4galnt3b
0.109
setb
-0.018
BX537303.1
0.108
cirbpb
-0.018
degs2
0.107
si:ch211-137a8.4
-0.017
si:ch211-256e16.6
0.106
hnrnpa0a
-0.017
si:ch1073-443f11.2
0.106
sf3b5
-0.017
stx2b
0.103
zc4h2
-0.016
zgc:123295
0.103
h2afva
-0.016
zgc:112408
0.102
cct5
-0.016
b3gnt5a
0.102
fabp3
-0.016
spint2
0.100
tubb5
-0.016
zgc:101744
0.098
hmgb1a
-0.016
st6galnac1.1
0.097
rpl17
-0.016
zgc:154054
0.096
cbx5
-0.016
tmem45b
0.095
hmgb2b
-0.016
si:dkey-188i13.6
0.094
tubb4b
-0.015