Daniocell
si:ch211-207e14.4 (mesenchyme)
si:ch211-207e14.4
ZFIN
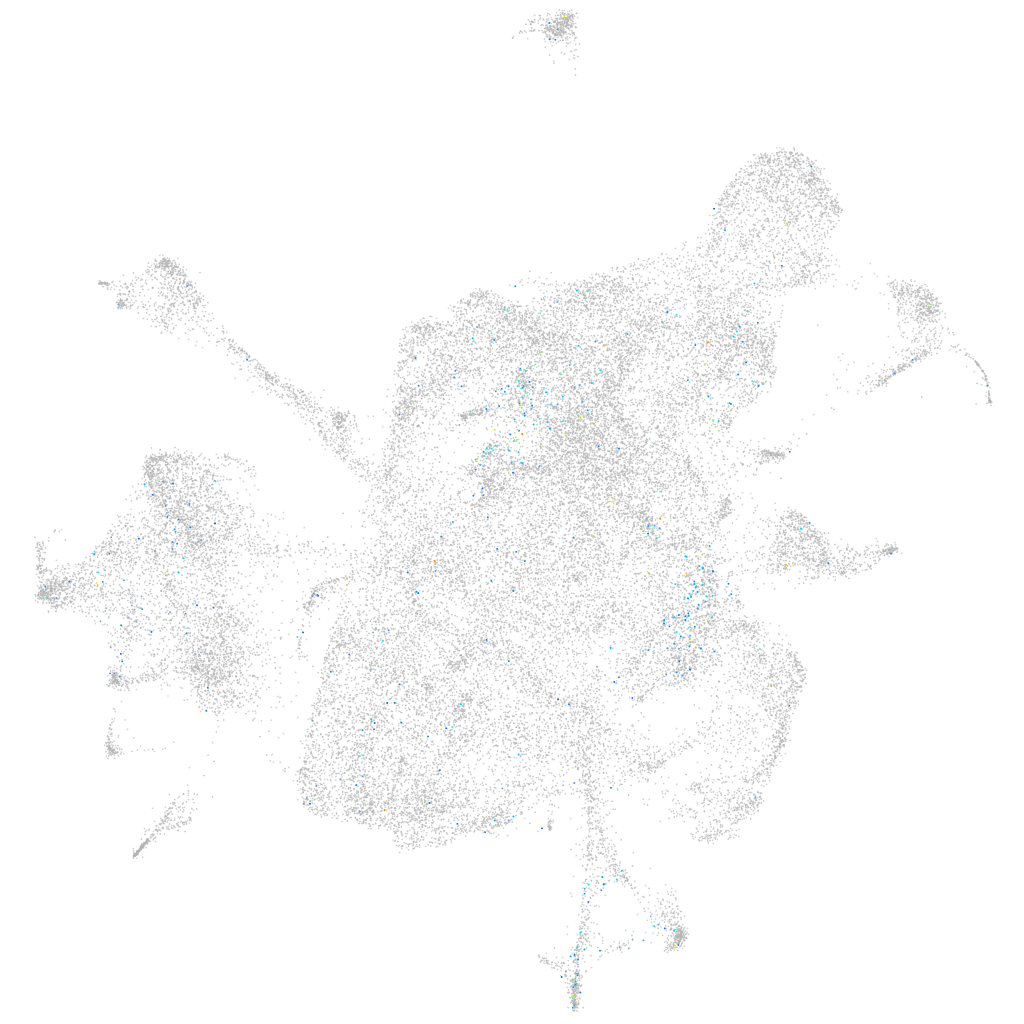
Gene expression UMAP
Display:
Expression
Stage
Other cell groups
all cells
blastomeres
PGCs
endoderm
axial mesoderm
muscle
mural cells /
non-skeletal muscle
mesenchyme
hematopoietic /
vasculature
pronephros
neural
spinal cord / glia
eye
taste / olfactory
otic / lateral line
epidermis
periderm
fin
ionocytes / mucous
pigment cells
Expression by stage/cluster
Correlated gene expression
Positive correlation
Negative correlation
Gene
r
Gene
r
LOC110439391
0.085
marcksb
-0.033
CT027589.1
0.085
h2afvb
-0.032
LOC103911828
0.075
snrpb
-0.031
rnf207a
0.074
hmgb2a
-0.031
dram1
0.067
hmga1a
-0.030
crhr2.2
0.067
tubb2b
-0.030
esrrd
0.064
si:ch211-222l21.1
-0.029
or122-1
0.062
snrpd1
-0.028
rgs5a
0.062
ptmab
-0.028
si:ch211-106h4.12
0.060
tmsb4x
-0.027
foxl2b
0.060
ptges3b
-0.027
NC-002333.19
0.059
snrpf
-0.027
ifitm1
0.058
h3f3d
-0.027
si:dkey-3h2.2
0.058
zbtb16a
-0.026
LO018363.2
0.055
hmgb2b
-0.026
si:ch211-251f6.6
0.055
h3f3a
-0.026
epd
0.053
tuba8l4
-0.026
apof
0.053
hmgn6
-0.025
si:dkey-58b18.8
0.053
fgfbp2b
-0.025
LOC100002960
0.053
smarce1
-0.025
NC-002333.21
0.051
sf3b5
-0.025
zgc:174259
0.050
apex1
-0.025
mchr2
0.050
uba2
-0.025
ntd5
0.050
si:ch211-51e12.7
-0.024
ftr87
0.050
ddx39ab
-0.024
si:dkeyp-106c3.1
0.050
ppid
-0.024
ggctb
0.049
lsm6
-0.024
rerglb
0.049
magoh
-0.024
LOC108191643.1
0.048
si:ch211-288g17.3
-0.023
zgc:173443
0.048
ilf2
-0.023
lamc3
0.048
p4ha1b
-0.023
LOC100537040
0.048
top1l
-0.023
zgc:153146
0.048
cfl1
-0.023
col4a5
0.047
tmem88b
-0.023
si:ch211-260p9.3
0.047
u2af1
-0.023