Daniocell
si:ch211-207e14.4 (hematopoietic / vasculature)
si:ch211-207e14.4
ZFIN
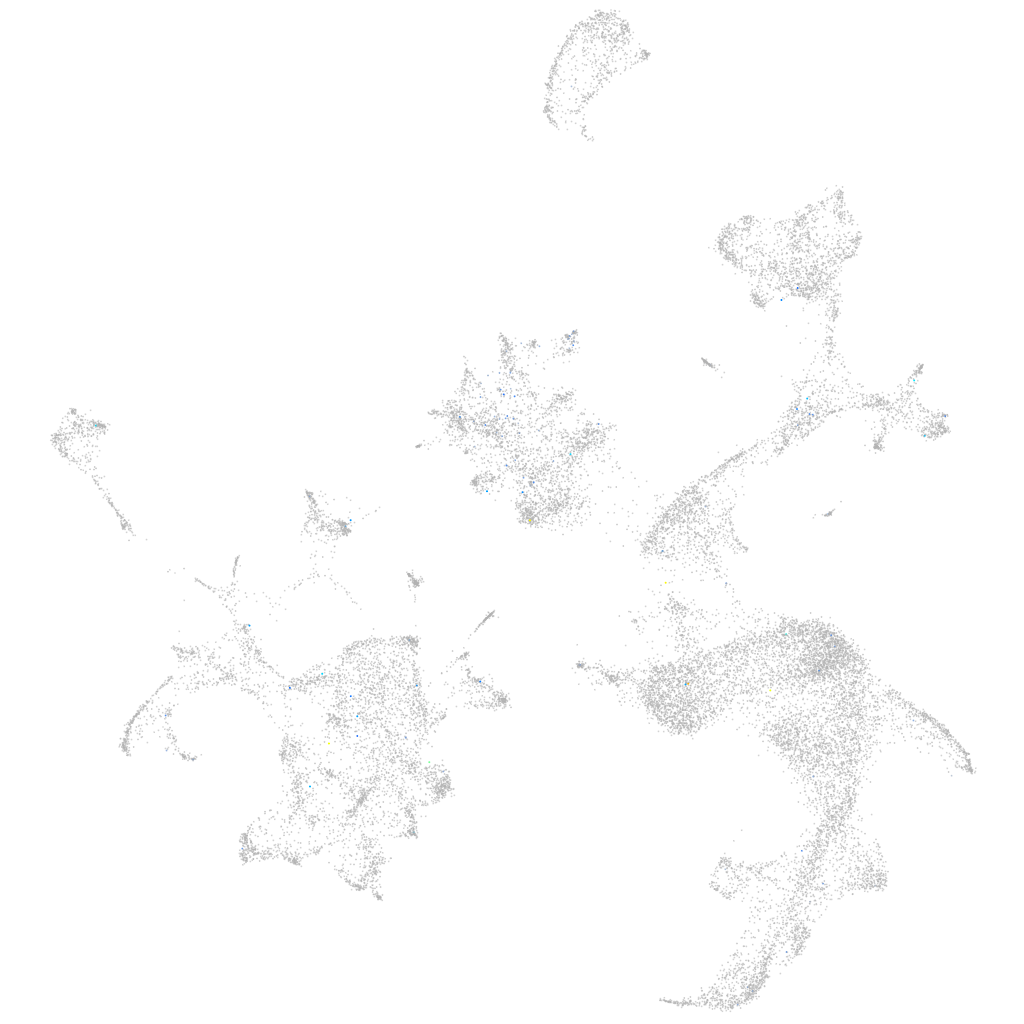
Gene expression UMAP
Display:
Expression
Stage
Other cell groups
all cells
blastomeres
PGCs
endoderm
axial mesoderm
muscle
mural cells /
non-skeletal muscle
mesenchyme
hematopoietic /
vasculature
pronephros
neural
spinal cord / glia
eye
taste / olfactory
otic / lateral line
epidermis
periderm
fin
ionocytes / mucous
pigment cells
Expression by stage/cluster
Correlated gene expression
Positive correlation
Negative correlation
Gene
r
Gene
r
LOC103908978.1
0.250
sptb
-0.020
zmp:0000001074
0.249
uros
-0.018
LO017791.1
0.203
si:ch211-114n24.6
-0.018
XLOC-001767
0.167
hemgn
-0.017
LOC100149991
0.152
ucp3
-0.016
si:dkeyp-35e5.9
0.140
zgc:163057
-0.015
ehf
0.137
bri3
-0.015
zgc:114120
0.130
hbbe3
-0.015
CCKBR
0.129
spi1b
-0.014
si:ch211-217k17.8
0.118
hdr
-0.014
trpc5b
0.109
blvrb
-0.014
mhc1uma
0.107
fcer1gl
-0.014
CR925804.1
0.103
si:dkey-27i16.2
-0.014
klc3
0.100
nmt1b
-0.014
klf6b
0.097
rhd
-0.014
CR450686.2
0.093
mknk2b
-0.013
si:dkey-1j5.4
0.089
znfl2a
-0.013
zgc:123284
0.087
b3gnt3.4
-0.013
drd5a
0.087
pgd
-0.013
XLOC-013920
0.085
rab11ba
-0.013
lsr
0.085
cldng
-0.013
LOC103910269
0.084
hebp2
-0.013
actr3b
0.083
prdx2
-0.013
cldna
0.082
dub
-0.013
mat1a
0.081
zgc:56699
-0.012
si:dkey-225f23.5
0.080
rhag
-0.012
LOC101886593
0.078
prdx3
-0.012
LOC103911725
0.077
glrx5
-0.012
LOC110438361
0.076
nrros
-0.012
si:ch73-380n15.2
0.076
gp1bb
-0.012
RF00319
0.075
plac8l1
-0.012
LOC101882303
0.075
si:dkey-102g19.3
-0.012
si:dkey-240n22.6
0.073
guk1a
-0.012
LOC101882617
0.073
laptm5
-0.012
pfkpb
0.073
hif1al2
-0.012