Daniocell
si:ch211-207e14.4 (axial mesoderm)
si:ch211-207e14.4
ZFIN
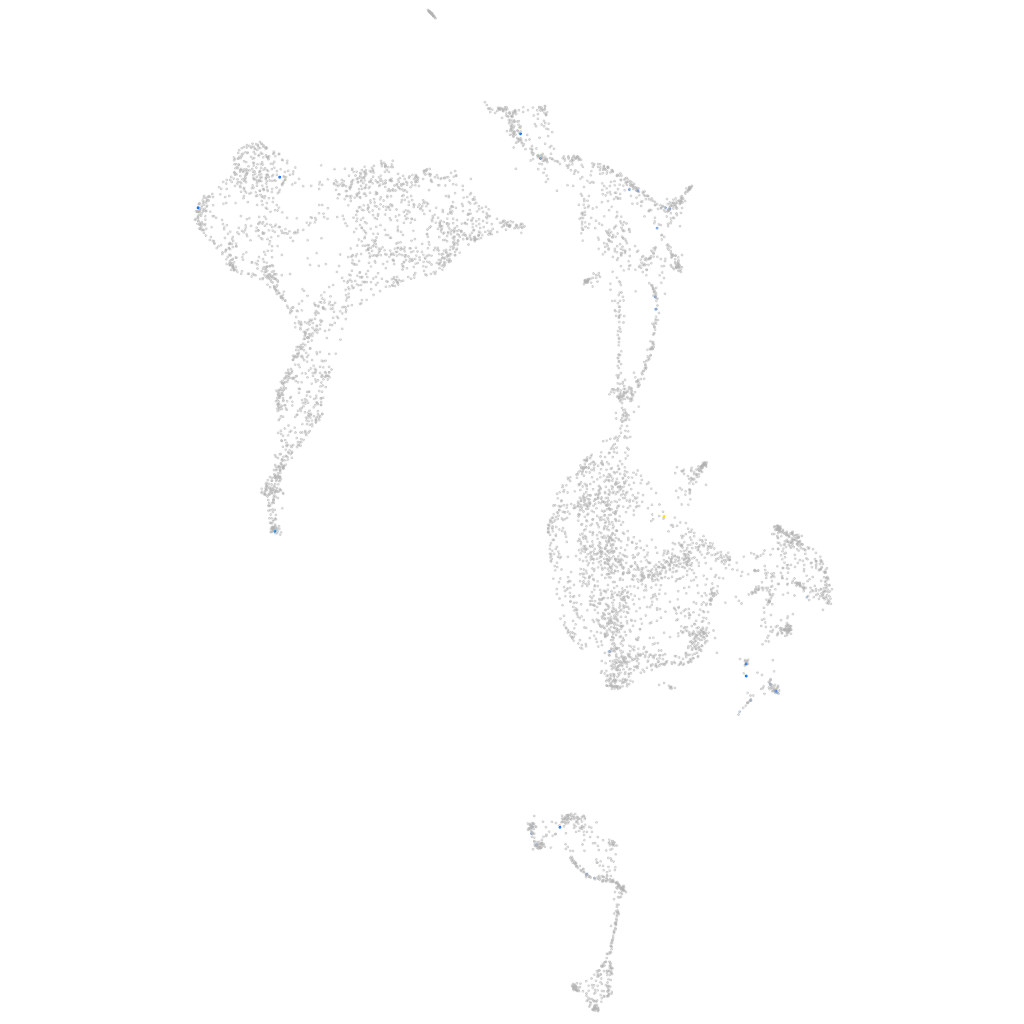
Gene expression UMAP
Display:
Expression
Stage
Other cell groups
all cells
blastomeres
PGCs
endoderm
axial mesoderm
muscle
mural cells /
non-skeletal muscle
mesenchyme
hematopoietic /
vasculature
pronephros
neural
spinal cord / glia
eye
taste / olfactory
otic / lateral line
epidermis
periderm
fin
ionocytes / mucous
pigment cells
Expression by stage/cluster
Correlated gene expression
Positive correlation
Negative correlation
Gene
r
Gene
r
LOC799796
0.595
ptmab
-0.050
LOC108183855
0.359
jpt2
-0.030
BX511079.1
0.339
cox7c
-0.029
aqp12
0.334
hnrnpm
-0.029
LOC101884200
0.281
marcksb
-0.028
CR356233.1
0.270
rps15
-0.028
SAMD8
0.268
cfl1
-0.027
si:dkeyp-46h3.1
0.261
csde1
-0.026
BX663606.1
0.249
ism1
-0.026
styk1a
0.247
ucmab
-0.025
wdr19
0.221
hmgb3a
-0.025
RF00019
0.217
top1l
-0.025
XLOC-042209
0.203
polr2j
-0.025
lats1
0.184
mmp23bb
-0.025
si:ch211-76m11.15
0.176
tgfbi
-0.024
XLOC-000597
0.169
chad
-0.024
LOC110439806
0.168
cirbpb
-0.024
igsf8
0.166
ppdpfa
-0.024
mslnb
0.166
prss35
-0.024
CABZ01040021.1
0.162
hnrnpub
-0.024
lrrc3cb
0.156
si:dkeyp-2e4.3
-0.023
tom1l2a
0.156
sdc2
-0.023
ism2a
0.154
rpl15
-0.023
si:dkey-175d9.2
0.153
hbbe1.3
-0.023
CELA1
0.151
ndr2
-0.023
LOC100535095
0.150
cavin2b
-0.023
si:ch211-266a5.12
0.148
rgcc
-0.022
CU929203.2
0.143
noc2l
-0.022
urgcp
0.143
gas2b
-0.022
mterf3
0.138
rsf1b.1
-0.022
p2ry12
0.138
si:ch211-288g17.3
-0.022
lrrn3b
0.137
tpx2
-0.022
CU914622.2
0.136
slc16a1b
-0.022
slc22a13b
0.135
hmgb2b
-0.022
si:ch211-139n6.3
0.134
si:ch73-352p4.8
-0.022