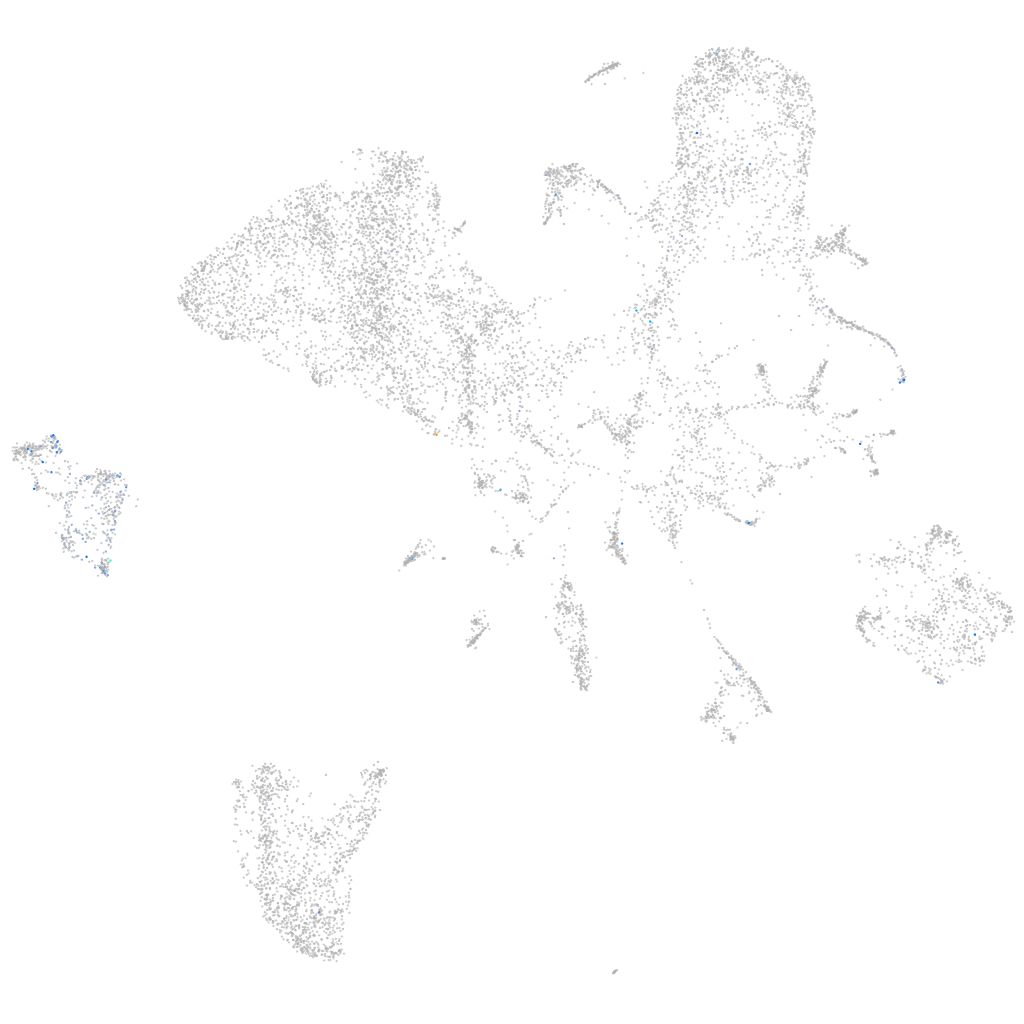
Daniocell
si:ch211-207e14.4 (endoderm)
si:ch211-207e14.4
ZFIN
Gene expression UMAP
Display:
Expression
Stage
Other cell groups
all cells
blastomeres
PGCs
endoderm
axial mesoderm
muscle
mural cells /
non-skeletal muscle
mesenchyme
hematopoietic /
vasculature
pronephros
neural
spinal cord / glia
eye
taste / olfactory
otic / lateral line
epidermis
periderm
fin
ionocytes / mucous
pigment cells
Expression by stage/cluster
Correlated gene expression
Positive correlation
Negative correlation
Gene
r
Gene
r
si:dkey-84h14.1
0.389
gamt
-0.083
XLOC-037388
0.346
gapdh
-0.082
si:ch211-167j9.4
0.278
gatm
-0.073
pdlim7
0.261
bhmt
-0.073
CABZ01059119.1
0.238
pklr
-0.070
si:dkeyp-92c9.2
0.225
gpx4a
-0.068
LOC108179652
0.225
aqp12
-0.066
CABZ01039859.1
0.222
fbp1b
-0.064
matn3b
0.213
apoa1b
-0.064
LOC101884753
0.211
mat1a
-0.063
LOC103911788
0.210
agxta
-0.062
gpa33a
0.209
agxtb
-0.061
asb10
0.205
apoa4b.1
-0.061
zgc:153665
0.205
gpd1b
-0.060
ponzr5
0.204
afp4
-0.060
p2ry1
0.201
grhprb
-0.060
dbnla
0.200
tfa
-0.059
gbgt1l4
0.198
cx32.3
-0.059
zgc:136963
0.195
pnp4b
-0.058
zgc:194007
0.192
apoc1
-0.057
LOC100537138
0.191
rbp2b
-0.056
si:cabz01007812.1
0.191
serpina1l
-0.056
CR589875.2
0.191
vtnb
-0.056
si:dkey-19b23.12
0.190
zgc:123103
-0.056
kcnq5a
0.186
g6pca.2
-0.055
zp2l2
0.184
slc27a2a
-0.055
si:dkey-266m15.6
0.183
apom
-0.055
si:ch73-347e22.8
0.179
apoc2
-0.055
slc35a3b
0.179
fetub
-0.055
casp6l1
0.178
apoa2
-0.055
si:ch73-50f9.4
0.177
kng1
-0.055
si:dkey-87o1.2
0.175
fgg
-0.055
CT573139.2
0.175
ambp
-0.055
si:dkey-205i10.1
0.174
fgb
-0.054
impdh1a
0.174
pcbd1
-0.054