Daniocell
degs2 (all cells)
"delta(4)-desaturase, sphingolipid 2"
ZFIN
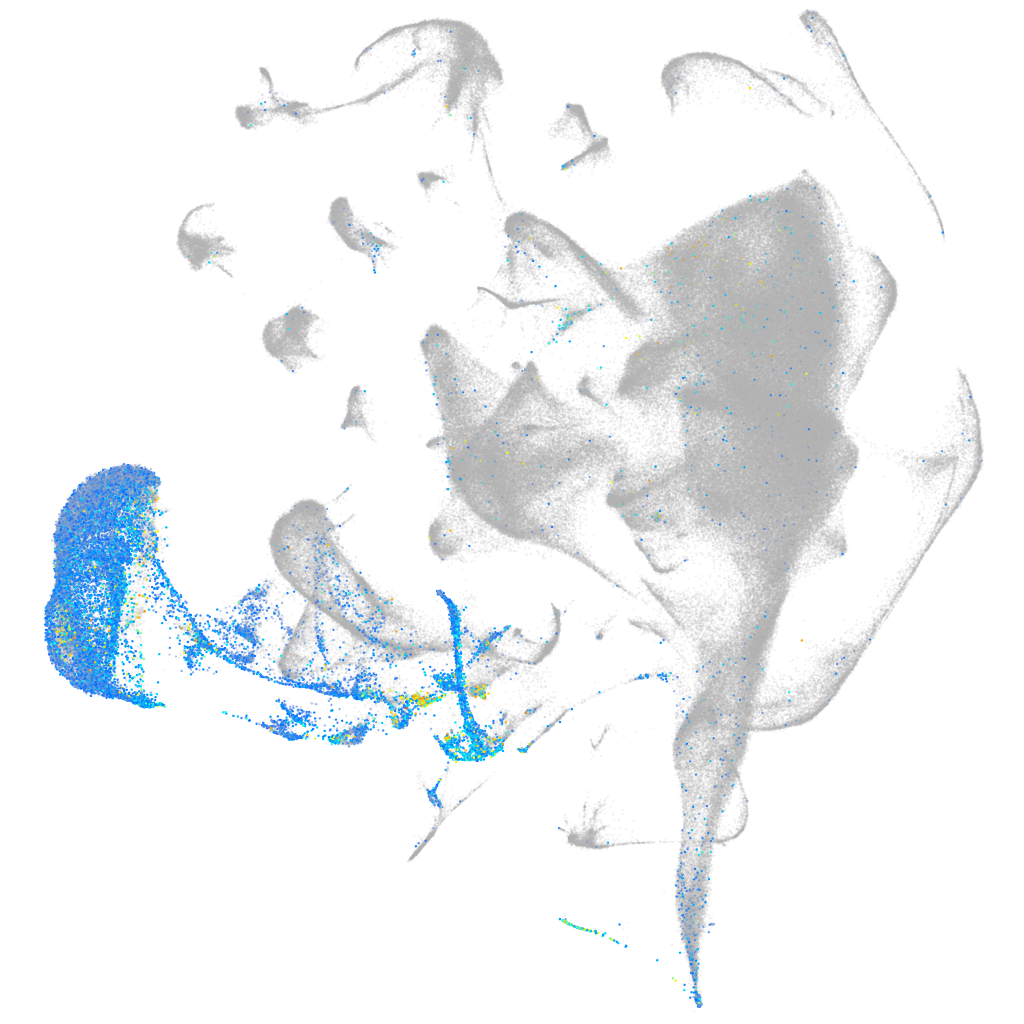
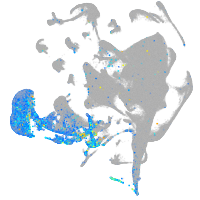
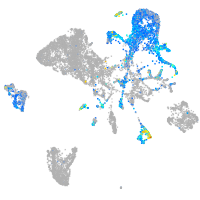
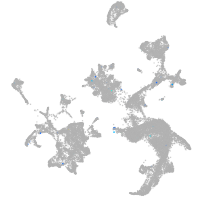
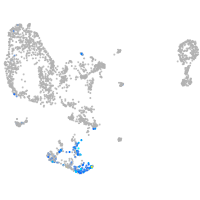
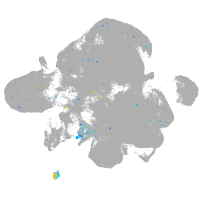
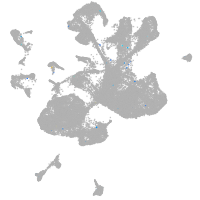
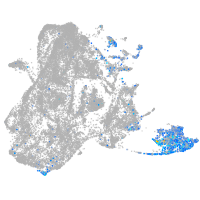
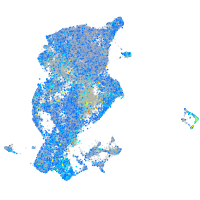
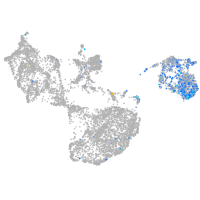
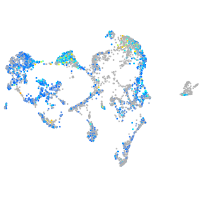
Gene expression UMAP
Display:
Expression
Stage
Other cell groups
all cells
blastomeres
PGCs
endoderm
axial mesoderm
muscle
mural cells /
non-skeletal muscle
mesenchyme
hematopoietic /
vasculature
pronephros
neural
spinal cord / glia
eye
taste / olfactory
otic / lateral line
epidermis
periderm
fin
ionocytes / mucous
pigment cells
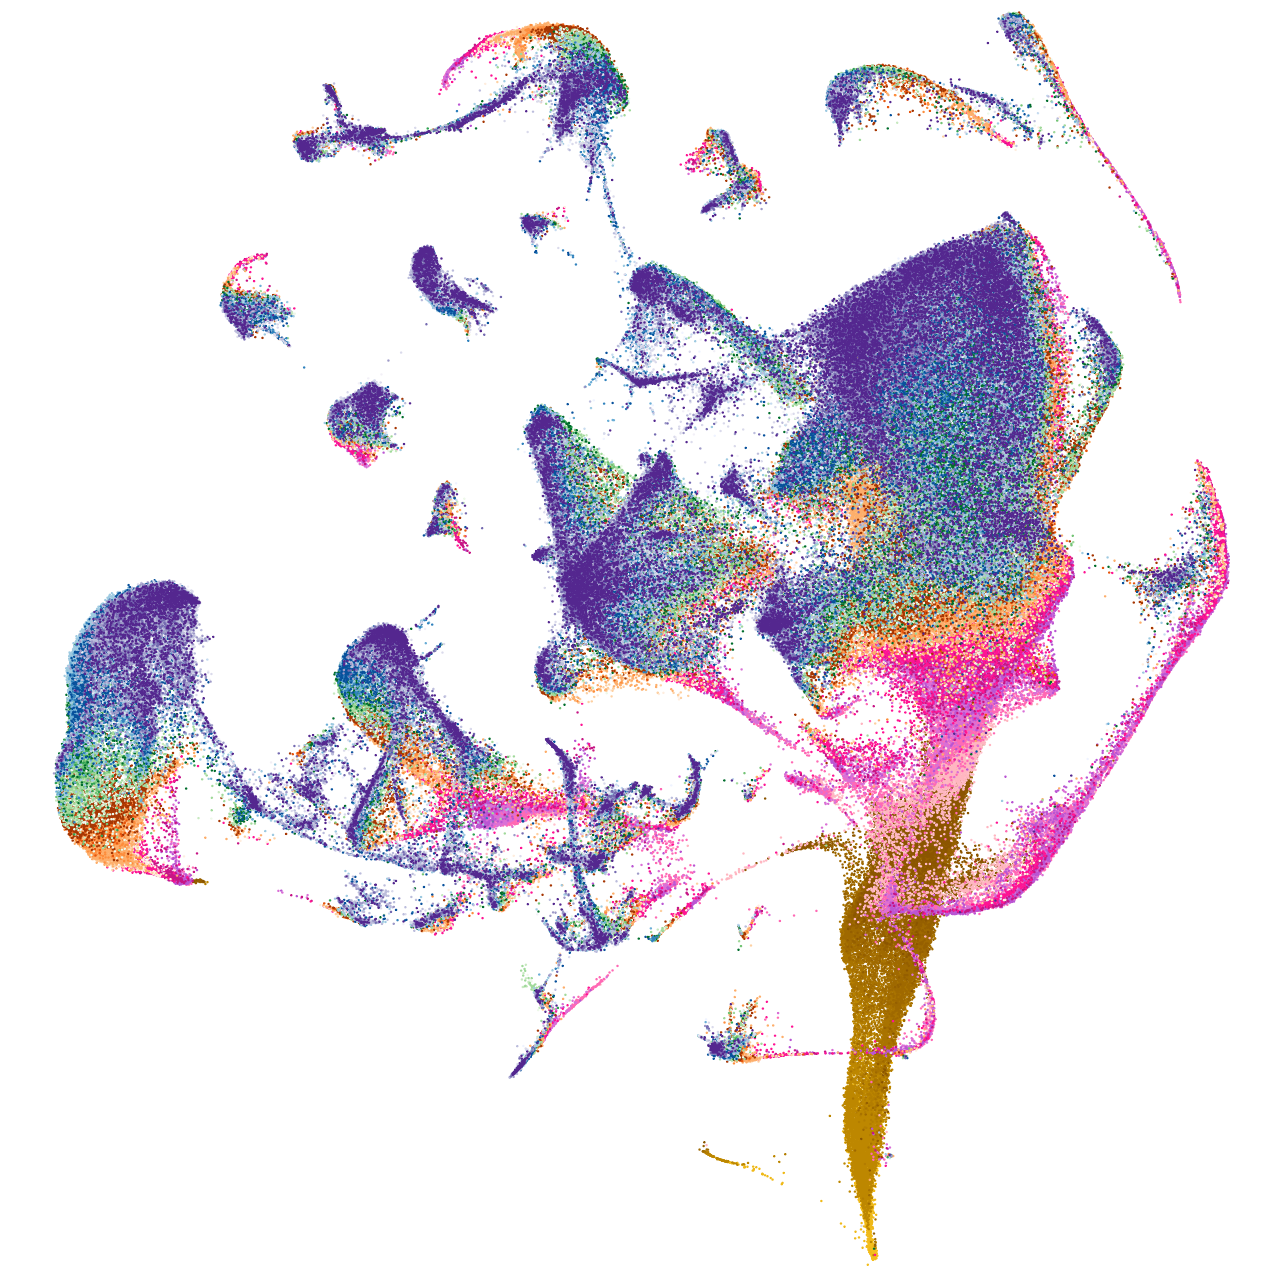
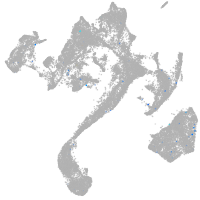
Expression by stage/cluster
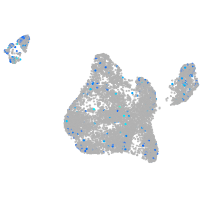
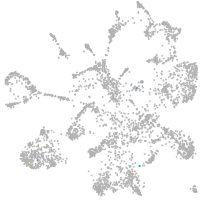
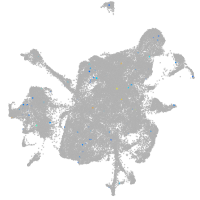
Correlated gene expression
Positive correlation
Negative correlation
Gene
r
Gene
r
si:dkey-87o1.2
0.471
hmgb1b
-0.186
cldne
0.455
hmgb3a
-0.163
cldnb
0.454
marcksb
-0.162
tmem45b
0.454
marcksl1a
-0.158
spint2
0.446
nova2
-0.157
si:ch73-347e22.8
0.427
si:dkey-56m19.5
-0.152
cd9b
0.425
tuba1c
-0.151
stard14
0.424
si:ch211-288g17.3
-0.150
ppl
0.423
hnrnpa0a
-0.145
wu:fb18f06
0.417
gpm6aa
-0.144
icn
0.413
mdkb
-0.141
cldn23a
0.412
si:ch211-137a8.4
-0.137
si:ch211-195b11.3
0.406
zc4h2
-0.137
lye
0.403
tuba1a
-0.134
si:ch211-79k12.1
0.401
nucks1a
-0.133
capn9
0.400
gpm6ab
-0.130
mid1ip1a
0.400
fabp3
-0.129
s100v1
0.400
ckbb
-0.127
si:ch211-157c3.4
0.399
si:dkey-276j7.1
-0.127
si:ch73-204p21.2
0.398
si:ch211-133n4.4
-0.126
zgc:193505
0.393
rtn1a
-0.125
si:ch1073-443f11.2
0.391
tmeff1b
-0.125
zgc:110333
0.391
fam168a
-0.124
anxa1c
0.390
hp1bp3
-0.123
ap1s3b
0.389
jpt1b
-0.123
gbgt1l4
0.387
tubb5
-0.123
oclnb
0.386
elavl3
-0.120
agr1
0.385
stmn1b
-0.119
anxa1b
0.384
celf2
-0.118
tmem176l.4
0.384
msna
-0.118
epcam
0.383
ewsr1a
-0.117
selenow2b
0.381
vdac3
-0.117
nqo1
0.380
cd81a
-0.114
rnf183
0.380
mdka
-0.114
znf185
0.380
sox11a
-0.114