Daniocell
itpr3 (all cells)
"inositol 1,4,5-trisphosphate receptor, type 3"
ZFIN
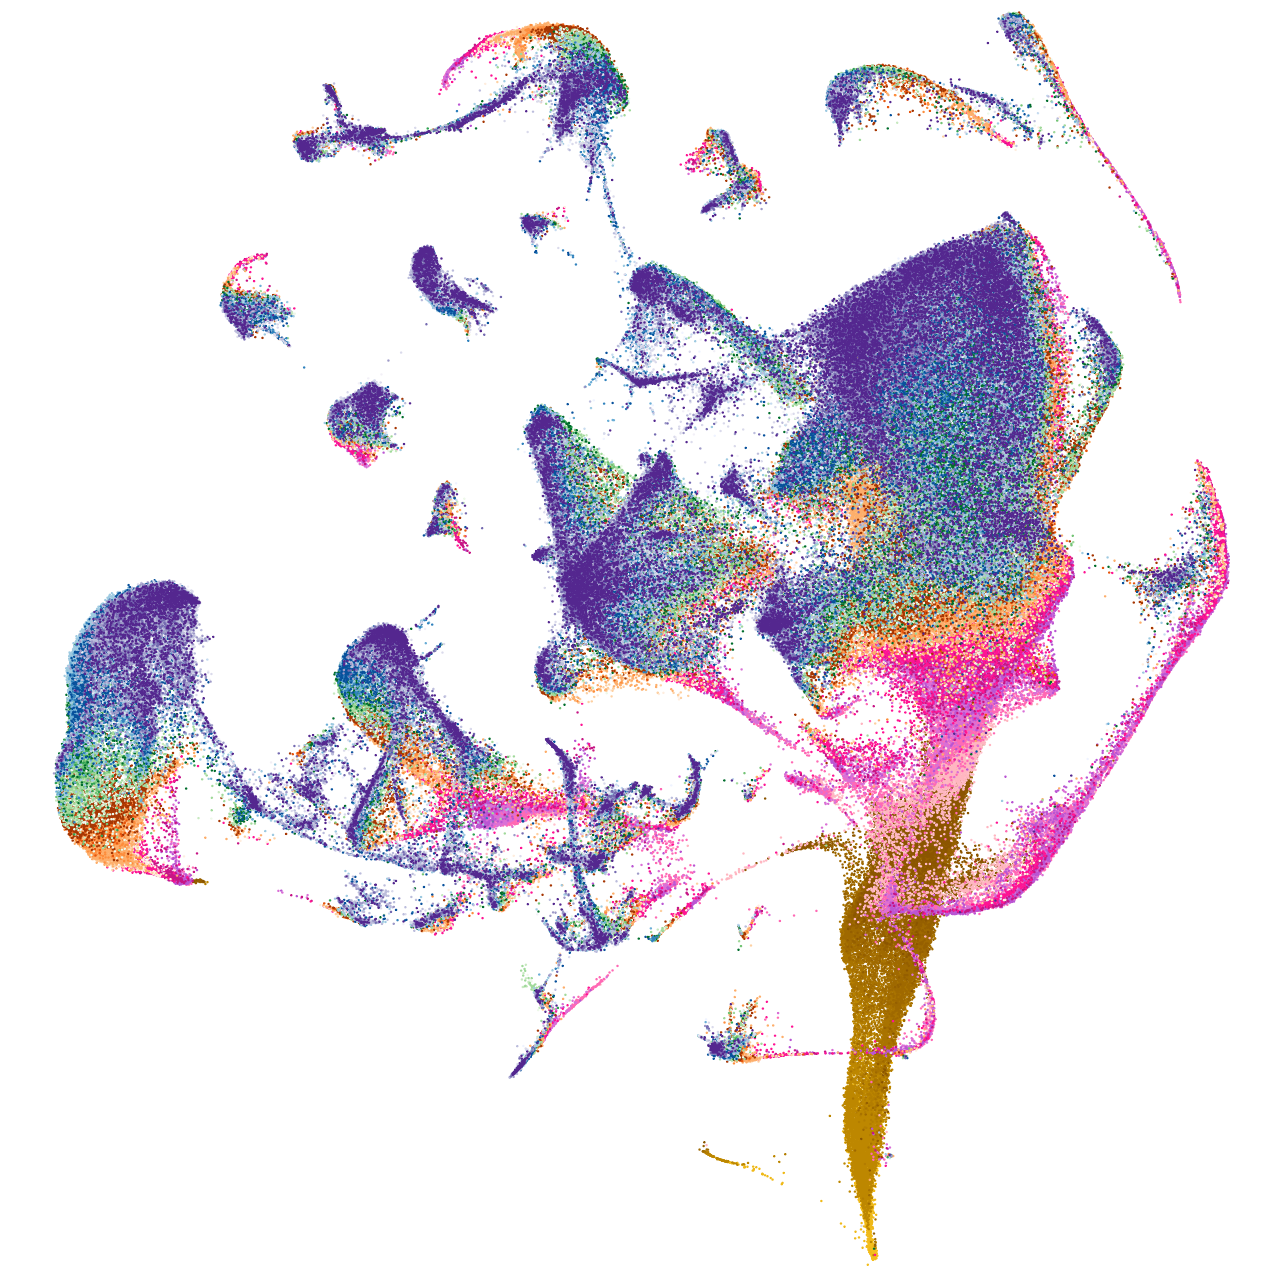
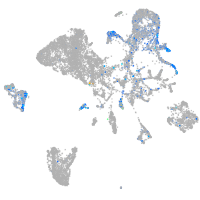
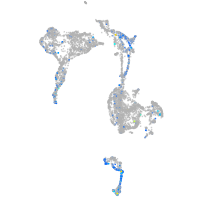
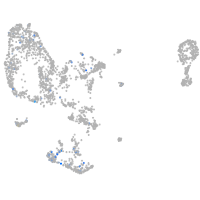
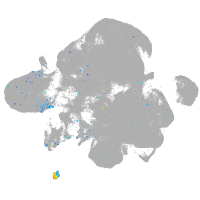
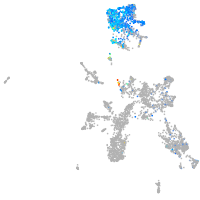
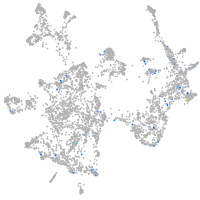
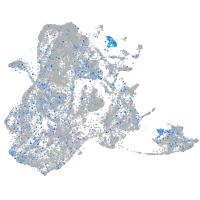
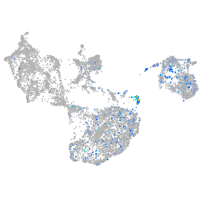
Gene expression UMAP
Display:
Expression
Stage
Other cell groups
all cells
blastomeres
PGCs
endoderm
axial mesoderm
muscle
mural cells /
non-skeletal muscle
mesenchyme
hematopoietic /
vasculature
pronephros
neural
spinal cord / glia
eye
taste / olfactory
otic / lateral line
epidermis
periderm
fin
ionocytes / mucous
pigment cells
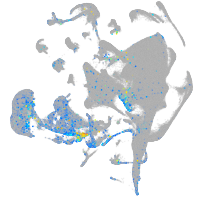
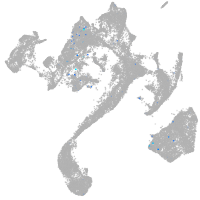
Expression by stage/cluster
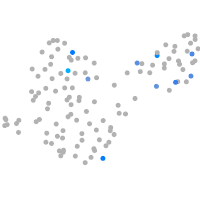
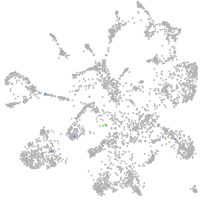
Correlated gene expression
Positive correlation
Negative correlation
Gene
r
Gene
r
gfral
0.386
hmgb1b
-0.095
CR759836.1
0.383
marcksb
-0.087
vill
0.337
nova2
-0.082
CABZ01073083.1
0.330
si:ch211-288g17.3
-0.080
grp
0.323
elavl3
-0.079
cldnh
0.315
rtn1a
-0.079
pou2f3
0.315
si:dkey-276j7.1
-0.078
zgc:92380
0.297
stmn1b
-0.078
prr15la
0.292
si:dkey-56m19.5
-0.077
si:ch211-256e16.6
0.286
zc4h2
-0.077
hepacam2
0.276
gpm6ab
-0.076
bik
0.252
hmgb3a
-0.076
si:ch211-130m23.2
0.244
tuba1c
-0.076
si:dkey-188i13.6
0.241
hnrnpa0a
-0.075
ponzr6
0.239
si:ch211-137a8.4
-0.073
ponzr5
0.236
tubb5
-0.073
rgs1
0.235
atp6v0cb
-0.069
zgc:101744
0.234
gng3
-0.069
zgc:123295
0.234
gpm6aa
-0.069
CABZ01072157.1
0.232
sncb
-0.068
si:ch211-149l1.2
0.232
si:ch211-133n4.4
-0.066
pvalb8
0.230
rtn1b
-0.065
atp2a3
0.226
epb41a
-0.064
b4galnt3b
0.221
tuba1a
-0.064
LOC103909697
0.221
nucks1a
-0.063
LOC100536671
0.219
ewsr1a
-0.062
epcam
0.218
smarce1
-0.062
avil
0.217
sox11a
-0.062
FP016247.2
0.212
celf2
-0.061
lad1
0.212
nkain1
-0.061
trpm5
0.212
ckbb
-0.060
si:dkeyp-80c12.5
0.210
tmeff1b
-0.060
zgc:171929
0.210
ywhag2
-0.060
si:ch1073-443f11.2
0.209
elavl4
-0.059
mir375-2
0.208
nono
-0.059