Daniocell
pax3b (axial mesoderm)
paired box 3b
ZFIN
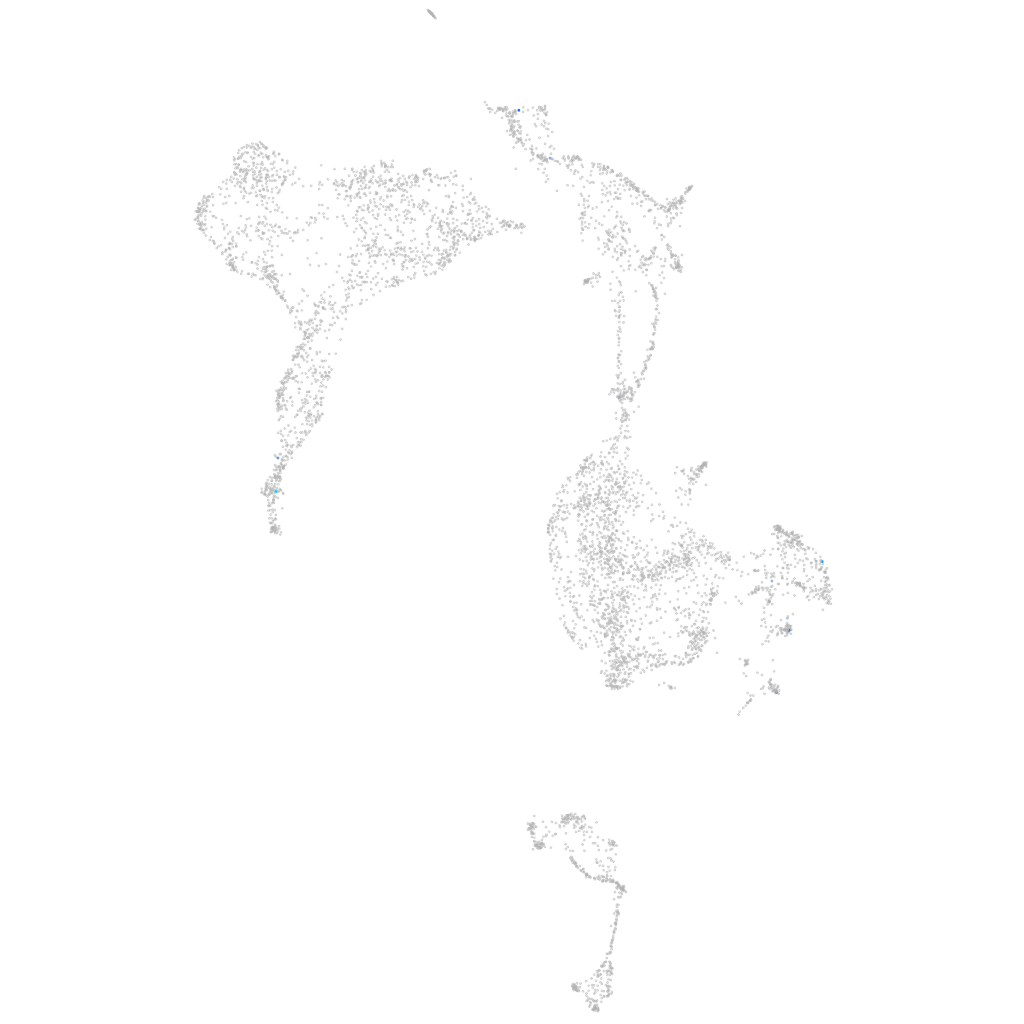
Gene expression UMAP
Display:
Expression
Stage
Other cell groups
all cells
blastomeres
PGCs
endoderm
axial mesoderm
muscle
mural cells /
non-skeletal muscle
mesenchyme
hematopoietic /
vasculature
pronephros
neural
spinal cord / glia
eye
taste / olfactory
otic / lateral line
epidermis
periderm
fin
ionocytes / mucous
pigment cells
Expression by stage/cluster
Correlated gene expression
Positive correlation
Negative correlation
Gene
r
Gene
r
si:ch211-1o7.2
0.351
selenof
-0.032
CR556709.1
0.304
atp6v0ca
-0.028
XLOC-013106
0.287
ube2na
-0.027
tmem184bb
0.279
ctnnb1
-0.025
arfip2b
0.273
tia1l
-0.025
LOC100537030
0.263
zgc:92818
-0.025
si:ch211-215d8.2
0.226
serf2
-0.024
CR854964.1
0.213
pdia6
-0.022
mir30a
0.212
msna
-0.022
ifnlr1
0.210
acin1b
-0.022
CR381673.2
0.203
si:rp71-45k5.4
-0.022
si:ch211-209f23.6
0.192
sec13
-0.021
ANPEP
0.190
rer1
-0.021
ppp1r27b
0.182
arpc1a
-0.021
FO744854.1
0.179
tbxta
-0.021
CABZ01118767.1
0.178
atp1a1a.1
-0.020
AL928977.1
0.178
wu:fi46h04
-0.020
neurl1aa
0.177
insb
-0.020
CR391953.1
0.173
rbm6
-0.020
si:ch211-142b24.2
0.169
mfap1
-0.020
pax2b
0.167
si:ch73-238c9.1
-0.020
drd2l
0.164
taf10
-0.020
CU571061.1
0.162
anxa13
-0.020
CU633775.1
0.161
mt-nd3
-0.020
slc25a27
0.157
p4ha2
-0.019
LOC110438754
0.156
hic1l
-0.019
prom1b
0.156
foxa2
-0.019
onecutl
0.152
leo1
-0.019
si:dkeyp-77c4.1
0.152
myg1
-0.019
LOC101883185
0.149
kpna3
-0.019
zgc:158659
0.144
nelfe
-0.019
fgf18a
0.142
zfand5a
-0.019
prdm8
0.136
sec62
-0.019
rab36
0.136
tmem263
-0.019
fetub
0.133
sept6
-0.019