Daniocell
pax3b (fin)
paired box 3b
ZFIN
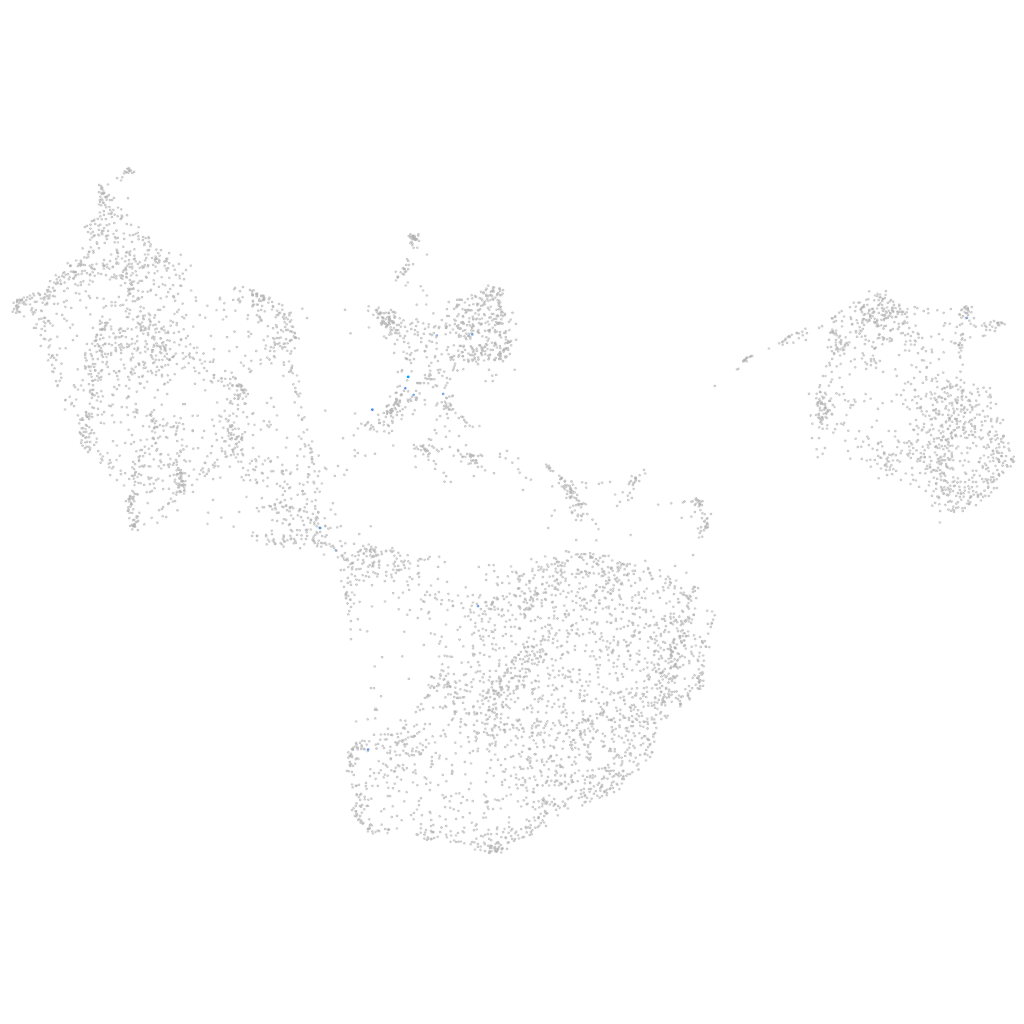
Gene expression UMAP
Display:
Expression
Stage
Other cell groups
all cells
blastomeres
PGCs
endoderm
axial mesoderm
muscle
mural cells /
non-skeletal muscle
mesenchyme
hematopoietic /
vasculature
pronephros
neural
spinal cord / glia
eye
taste / olfactory
otic / lateral line
epidermis
periderm
fin
ionocytes / mucous
pigment cells
Expression by stage/cluster
Correlated gene expression
Positive correlation
Negative correlation
Gene
r
Gene
r
opn4b
0.508
sparc
-0.034
si:ch211-117c19.1
0.423
col1a1a
-0.023
cx52.7
0.378
ecrg4b
-0.018
LOC103911067
0.373
znf185
-0.017
CR735104.1
0.373
hoxa13b
-0.017
grxcr1a.1
0.322
alas1
-0.017
si:ch211-276i12.4
0.280
cited4a
-0.017
slc4a3
0.273
tnc
-0.017
LOC103911814
0.273
itgav
-0.017
aqp9a
0.269
creb3l2
-0.016
LOC101886255
0.260
itgb3a
-0.016
CU179699.1
0.256
nck1a
-0.016
CU571382.4
0.232
nucb2a
-0.016
CR352232.1
0.216
wu:fi04e12
-0.016
BX248322.1
0.216
nqo1
-0.016
myf5
0.214
agr1
-0.016
tcf15
0.207
smim13
-0.016
saxo2
0.205
wnt7aa
-0.015
FP340257.1
0.205
bnipl
-0.015
LOC101885337
0.200
bambib
-0.015
si:ch211-262h13.5
0.193
si:ch73-217n20.1
-0.015
fhod3a
0.193
ada
-0.015
epsti1
0.191
wu:fa03e10
-0.015
si:ch211-285j22.3.1
0.190
prkacaa
-0.015
itln3
0.186
stau2
-0.015
unc5a
0.184
sept9a
-0.015
kcnj14
0.176
golga5
-0.015
CR383672.2
0.173
antxr2a
-0.015
INHBC
0.173
zgc:66479
-0.014
oxtr
0.173
bloc1s6
-0.014
CABZ01092170.1
0.173
taok1b
-0.014
si:dkeyp-53e4.1
0.173
camk2g1
-0.014
BX323559.2
0.171
tcnbb
-0.014
slc4a5b
0.170
csad
-0.014
btbd17b
0.169
ckma
-0.014