Daniocell
pax3b (periderm)
paired box 3b
ZFIN
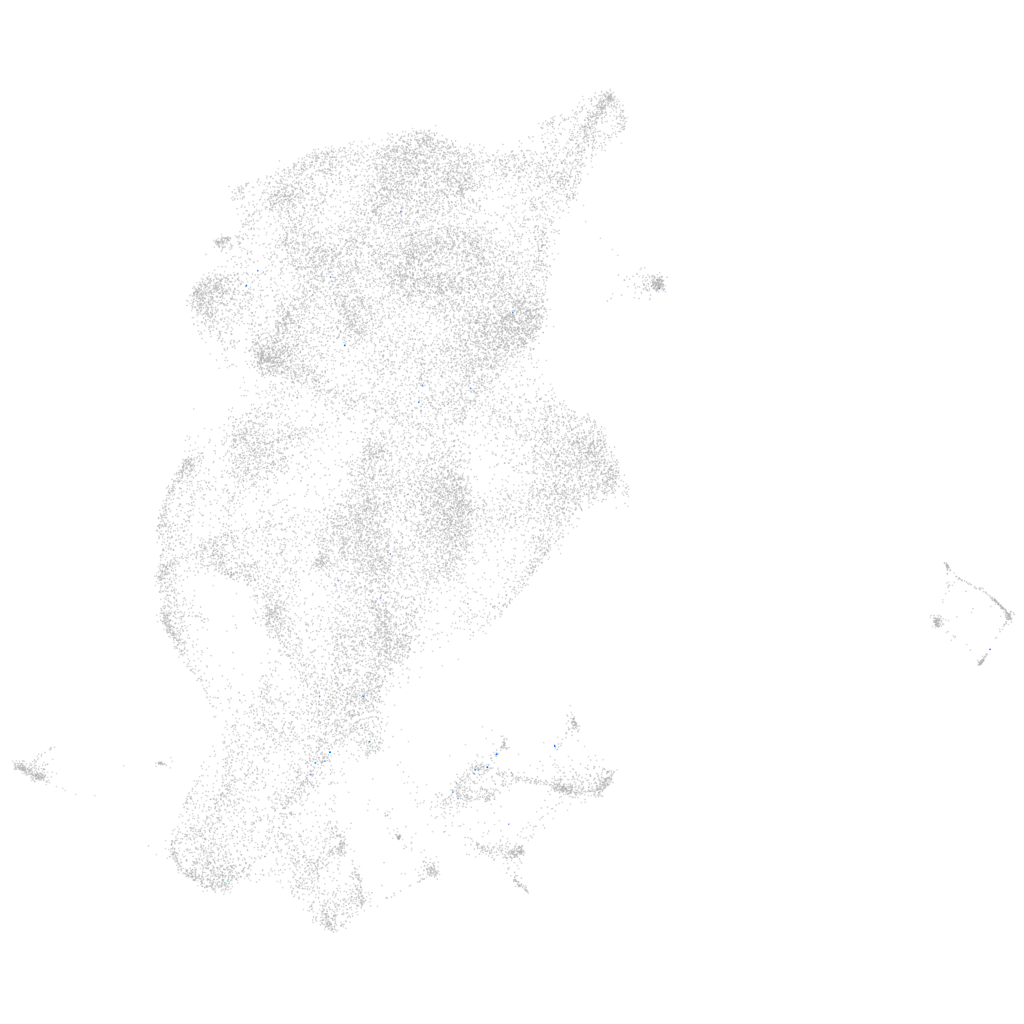
Gene expression UMAP
Display:
Expression
Stage
Other cell groups
all cells
blastomeres
PGCs
endoderm
axial mesoderm
muscle
mural cells /
non-skeletal muscle
mesenchyme
hematopoietic /
vasculature
pronephros
neural
spinal cord / glia
eye
taste / olfactory
otic / lateral line
epidermis
periderm
fin
ionocytes / mucous
pigment cells
Expression by stage/cluster
Correlated gene expression
Positive correlation
Negative correlation
Gene
r
Gene
r
EGFLAM
0.309
tcnbb
-0.017
LOC101882559
0.219
zgc:114188
-0.017
capslb
0.170
rplp2
-0.016
CABZ01067980.1
0.167
rps21
-0.016
tradv3.0.4
0.163
rps23
-0.016
CR848705.1
0.152
rps10
-0.016
LOC108182782
0.143
rps19
-0.015
oc90
0.141
sec61g
-0.015
BX255896.1
0.121
si:busm1-57f23.1
-0.014
XLOC-010592
0.121
rps27a
-0.013
fam181b
0.120
si:dkey-248g15.3
-0.013
BX322577.1
0.119
si:dkeyp-1h4.6
-0.012
CU972454.3
0.119
dhrs13a.1
-0.012
CR391940.1
0.118
CABZ01048956.1
-0.012
zgc:193690
0.118
apoa2
-0.012
mir199-2
0.108
foxp1a
-0.012
LOC103910515
0.104
si:dkey-193p11.2
-0.011
znf1148
0.093
abcb5
-0.011
chodl
0.092
mgarp
-0.011
CU019663.1
0.089
sdhc
-0.011
LOC101884517
0.089
icn2
-0.011
LOC101884514
0.089
zgc:113054
-0.011
XLOC-001374
0.089
foxq1a
-0.011
zic4
0.089
si:dkey-151g10.6
-0.011
slc22a7a
0.088
sec23b
-0.011
LOC103910921
0.087
rps29
-0.011
bmpr1ba
0.087
bin2b
-0.011
XLOC-015433
0.087
zmp:0000000991
-0.011
si:ch73-359m17.5
0.087
rpl37
-0.010
XLOC-042565
0.086
psme2
-0.010
foxi3a
0.084
rps11
-0.010
XLOC-022251
0.084
XLOC-011066
-0.010
BX088728.1
0.083
txn
-0.010
XLOC-032577
0.083
CR388079.3
-0.010
NPC2 (1 of many)
0.083
rpl28
-0.010