Daniocell
pax3b (mural cells / non-skeletal muscle)
paired box 3b
ZFIN
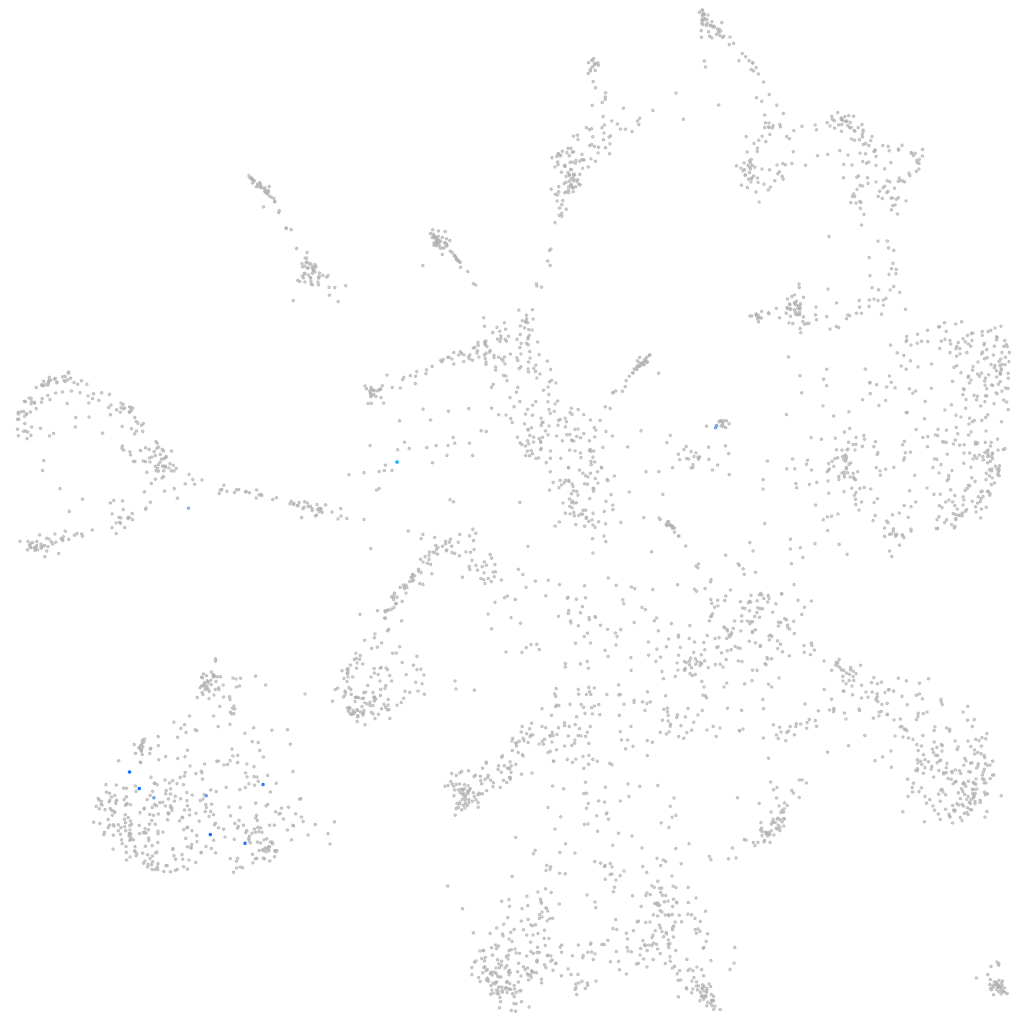
Gene expression UMAP
Display:
Expression
Stage
Other cell groups
all cells
blastomeres
PGCs
endoderm
axial mesoderm
muscle
mural cells /
non-skeletal muscle
mesenchyme
hematopoietic /
vasculature
pronephros
neural
spinal cord / glia
eye
taste / olfactory
otic / lateral line
epidermis
periderm
fin
ionocytes / mucous
pigment cells
Expression by stage/cluster
Correlated gene expression
Positive correlation
Negative correlation
Gene
r
Gene
r
acyp2
0.519
pvalb2
-0.028
LOC108179162
0.495
hspb1
-0.027
si:dkey-7j22.4
0.352
bambia
-0.026
LOC100536937
0.339
mylpfa
-0.026
pik3r5
0.338
rbpms2b
-0.026
LOC110437979
0.338
tmem88b
-0.025
si:dkeyp-46h3.8
0.338
lxn
-0.024
FO704819.1
0.326
lama4
-0.024
BX649516.5
0.321
tmsb4x
-0.024
si:dkey-88n24.8
0.302
lpp
-0.023
LOC110439787
0.266
si:dkey-9i23.16
-0.023
FO704821.1
0.264
aoc2
-0.023
slc13a4
0.260
glud1a
-0.023
morn2
0.213
hand2
-0.023
LOC108180112
0.205
trpc6a
-0.022
CT027801.2
0.204
jam2b
-0.022
hcn4
0.204
cd248a
-0.022
atoh1c
0.201
si:dkey-222f8.3
-0.022
AL844192.1
0.200
fstl1a
-0.022
batf
0.200
mylz3
-0.022
ghsra
0.200
chmp6b
-0.021
si:dkey-246j6.3
0.200
itga1
-0.021
si:dkeyp-101e12.1
0.200
fbn2b
-0.021
XLOC-032577
0.200
apoa2
-0.021
LOC101884441
0.198
si:ch211-195b11.3
-0.021
csf1b
0.195
apoa1b
-0.021
si:ch73-144d13.7
0.195
plpp1a
-0.021
nebl
0.194
si:ch211-51c14.1
-0.021
gga3b
0.191
phactr4a
-0.020
SLCO3A1 (1 of many)
0.185
lurap1
-0.020
shroom1
0.182
fstl1b
-0.020
si:ch1073-220m6.1
0.180
maff
-0.020
draxin
0.179
ecm1b
-0.020
myhc4
0.177
tmem176l.1
-0.020
LOC101882334
0.176
fosb
-0.020