Daniocell
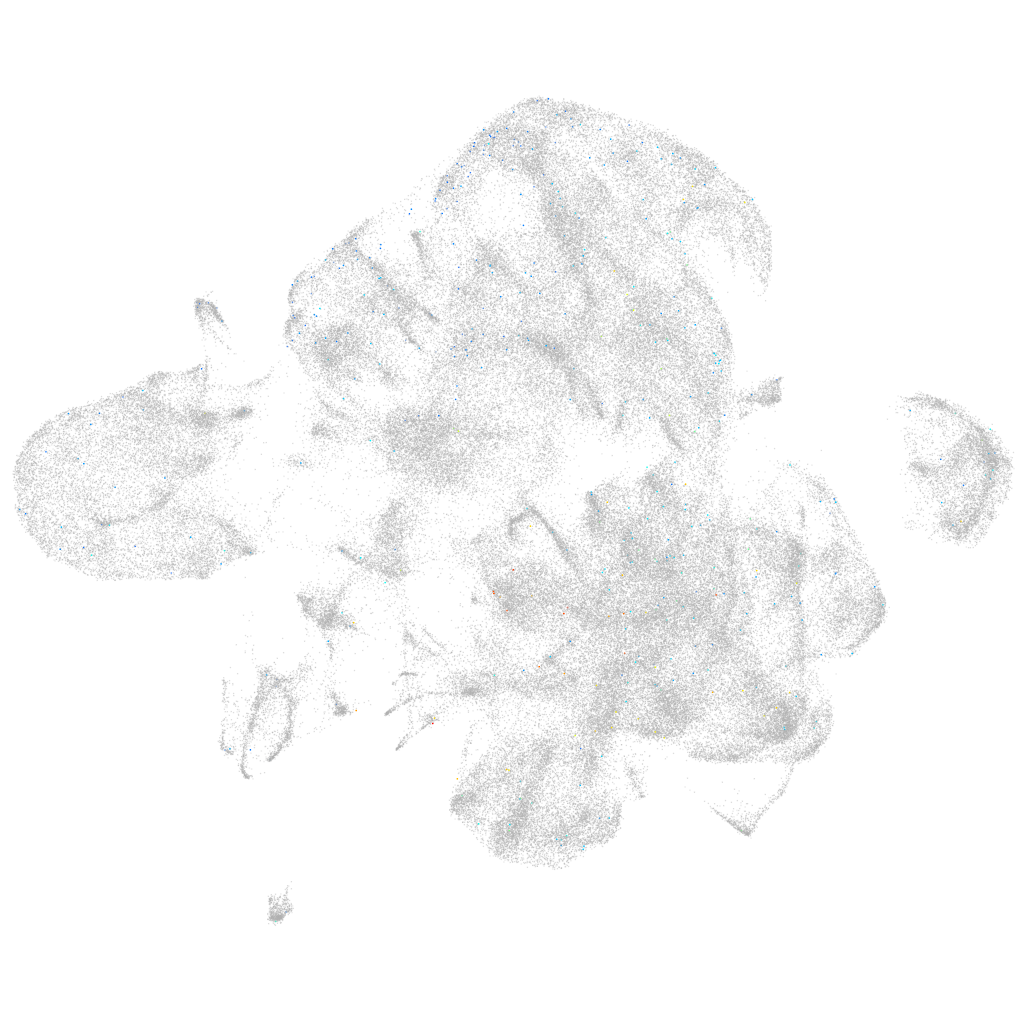
LOC100148023 (neural)
Gene expression UMAP
Display:
Expression
Stage
Other cell groups
all cells
blastomeres
PGCs
endoderm
axial mesoderm
muscle
mural cells /
non-skeletal muscle
mesenchyme
hematopoietic /
vasculature
pronephros
neural
spinal cord / glia
eye
taste / olfactory
otic / lateral line
epidermis
periderm
fin
ionocytes / mucous
pigment cells
Expression by stage/cluster
Correlated gene expression
Positive correlation
Negative correlation
Gene
r
Gene
r
sst2
0.051
apoc1
-0.008
mmp13b
0.044
anp32e
-0.008
LO017974.1
0.043
spc25
-0.008
CR382383.2
0.042
XLOC-001975
-0.007
CABZ01102201.1
0.037
oprl1
-0.007
nfixa
0.037
lig1
-0.007
BX120005.1
0.035
NC-002333.4
-0.007
LOC101885494
0.035
apoeb
-0.007
map3k15
0.034
pabpc1a
-0.007
leap2
0.034
zgc:112102
-0.007
BX908740.1
0.032
hspb1
-0.007
LOC110440108
0.032
si:dkeyp-38g8.5
-0.007
HTRA2 (1 of many).6
0.032
LOC108190024
-0.007
tfr2
0.032
eif3ja
-0.007
nmba
0.031
rpf1
-0.007
XLOC-020303
0.031
si:ch211-152c2.3
-0.007
CABZ01023255.1
0.030
srp14
-0.007
pimr173
0.029
rps18
-0.007
BX537130.1
0.028
bms1
-0.007
si:dkey-98j1.5
0.028
si:ch73-62l21.1
-0.007
BX663525.2
0.027
sp5l
-0.007
CU694264.1
0.026
zmp:0000000624
-0.006
vipr1a
0.026
mrps28
-0.006
ch25h
0.025
atp5f1e
-0.006
CR936300.1
0.025
mtg2
-0.006
si:ch211-116o3.6
0.025
pes
-0.006
CU855552.1
0.024
metap2b
-0.006
FQ377991.1
0.023
rnf113a
-0.006
sst1.2
0.023
cox7c
-0.006
LOC101883594
0.023
stm
-0.006
gls2b
0.023
ccdc6b
-0.006
mir30d
0.022
frmd4ba
-0.006
slc7a7
0.022
spon1a
-0.006
rapgef4
0.022
rrp7a
-0.006
miox
0.022
zgc:136930
-0.006