Daniocell
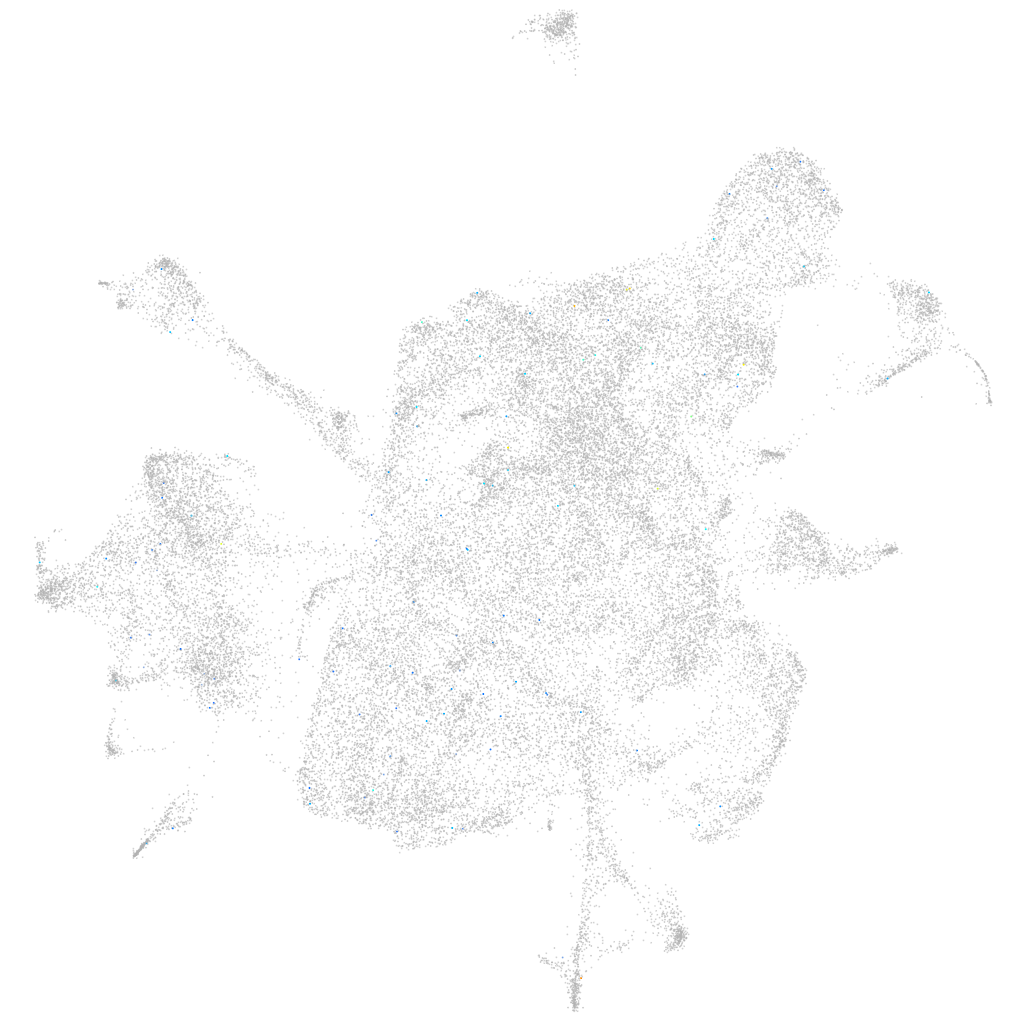
LOC100148023 (mesenchyme)
Gene expression UMAP
Display:
Expression
Stage
Other cell groups
all cells
blastomeres
PGCs
endoderm
axial mesoderm
muscle
mural cells /
non-skeletal muscle
mesenchyme
hematopoietic /
vasculature
pronephros
neural
spinal cord / glia
eye
taste / olfactory
otic / lateral line
epidermis
periderm
fin
ionocytes / mucous
pigment cells
Expression by stage/cluster
Correlated gene expression
Positive correlation
Negative correlation
Gene
r
Gene
r
FP016019.1
0.109
plxdc2
-0.012
LOC101883472
0.084
meis1a
-0.012
XLOC-032087
0.080
ywhae1
-0.012
pimr185
0.069
ephb4a
-0.011
RF00478
0.067
brd9
-0.011
CT573793.2
0.065
zgc:162612
-0.010
LOC110437859
0.064
sept9b
-0.010
LOC103910662
0.063
leng8
-0.010
CABZ01059626.1
0.063
crabp1b
-0.010
fndc4a
0.062
cyp2ad3
-0.010
si:ch73-186j5.2
0.062
kitlga
-0.010
CR762407.2
0.061
zmp:0000000846
-0.009
CABZ01061498.1
0.060
rps6
-0.009
vtcn1
0.060
camk2g1
-0.009
CABZ01112025.1
0.059
ptn
-0.009
LOC101886712
0.059
cd151
-0.009
XLOC-027155
0.057
foxp1a
-0.009
CR931813.1
0.055
tpm4b
-0.009
LOC110440095
0.055
ext2
-0.009
si:dkey-183c6.9
0.055
BX569787.1
-0.009
zgc:171446
0.052
cygb1
-0.009
PAOX
0.050
enpp2
-0.009
sbk3
0.050
rspo3
-0.009
mon1a
0.050
si:ch211-237c6.4
-0.009
si:dkey-16m19.1
0.049
rnf216
-0.009
chrnb1l
0.049
si:dkey-266m15.6
-0.009
prox2
0.047
rpl29
-0.009
tecrl2b
0.046
chp1
-0.008
LOC101882584
0.046
rbms3
-0.008
CU207354.2
0.046
sympk
-0.008
CT583728.14
0.046
rpl14
-0.008
si:dkey-1b17.9
0.045
sfrp5
-0.008
wfs1b
0.044
fam32a
-0.008
cd28
0.044
mylpfb
-0.008
XLOC-012418
0.043
hyal2b
-0.008