Daniocell
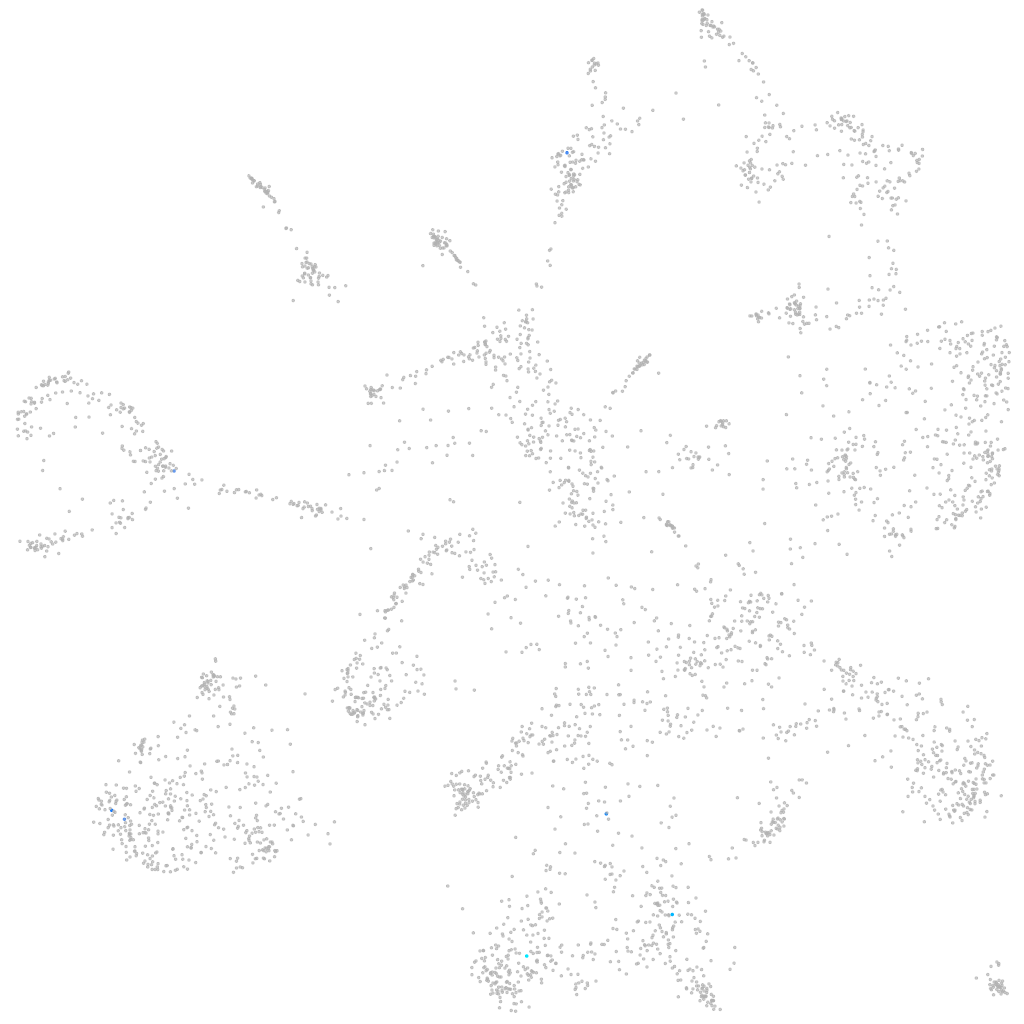
LOC100148023 (mural cells / non-skeletal muscle)
Gene expression UMAP
Display:
Expression
Stage
Other cell groups
all cells
blastomeres
PGCs
endoderm
axial mesoderm
muscle
mural cells /
non-skeletal muscle
mesenchyme
hematopoietic /
vasculature
pronephros
neural
spinal cord / glia
eye
taste / olfactory
otic / lateral line
epidermis
periderm
fin
ionocytes / mucous
pigment cells
Expression by stage/cluster
Correlated gene expression
Positive correlation
Negative correlation
Gene
r
Gene
r
znfl1h
0.306
mdka
-0.036
si:ch211-194e1.7
0.306
hspb1
-0.026
CR376738.2
0.306
ppiaa
-0.026
XLOC-004482
0.276
actc1b
-0.025
cnga3a
0.265
mt-co1
-0.025
LOC101886528
0.220
mcl1b
-0.024
LOC108182660
0.220
si:dkey-112e7.2
-0.024
XLOC-012652
0.215
cebpb
-0.023
LOC101884473
0.210
mylz3
-0.023
EML5
0.185
spred2b
-0.022
BX530091.1
0.183
tmem88b
-0.022
si:ch1073-155h21.1
0.181
sltm
-0.021
BX547930.2
0.181
si:ch211-39i22.1
-0.021
si:ch211-38m6.7
0.181
ephb3
-0.021
ahrrb
0.180
cdon
-0.021
si:ch73-50f9.4
0.172
tmem176l.1
-0.021
zgc:163014
0.171
jam2b
-0.020
nsmfa
0.164
sf3b6
-0.020
si:ch211-114c17.1
0.155
pvalb2
-0.020
XLOC-032715
0.154
cxcl18b
-0.020
si:dkey-258f14.3
0.150
morf4l1
-0.020
AL627305.1
0.145
cbx1b
-0.020
mfsd2aa
0.143
tcf3b
-0.020
chst7
0.140
krt15
-0.019
nr1i2
0.139
podxl
-0.019
si:ch73-92e7.6
0.132
si:dkey-16p21.8
-0.019
ms4a17a.5
0.129
ctsla
-0.019
si:dkey-56m15.3
0.125
apoa1b
-0.019
gbe1b
0.119
si:dkey-9i23.16
-0.019
pappaa
0.117
si:ch211-260e23.9
-0.019
soul2
0.115
adgrl2a
-0.019
TMEM114
0.114
pon3.2
-0.019
parp9
0.113
krt94
-0.019
si:dkey-14d8.6
0.113
ednraa
-0.019
DMWD
0.112
qkia
-0.019