Daniocell
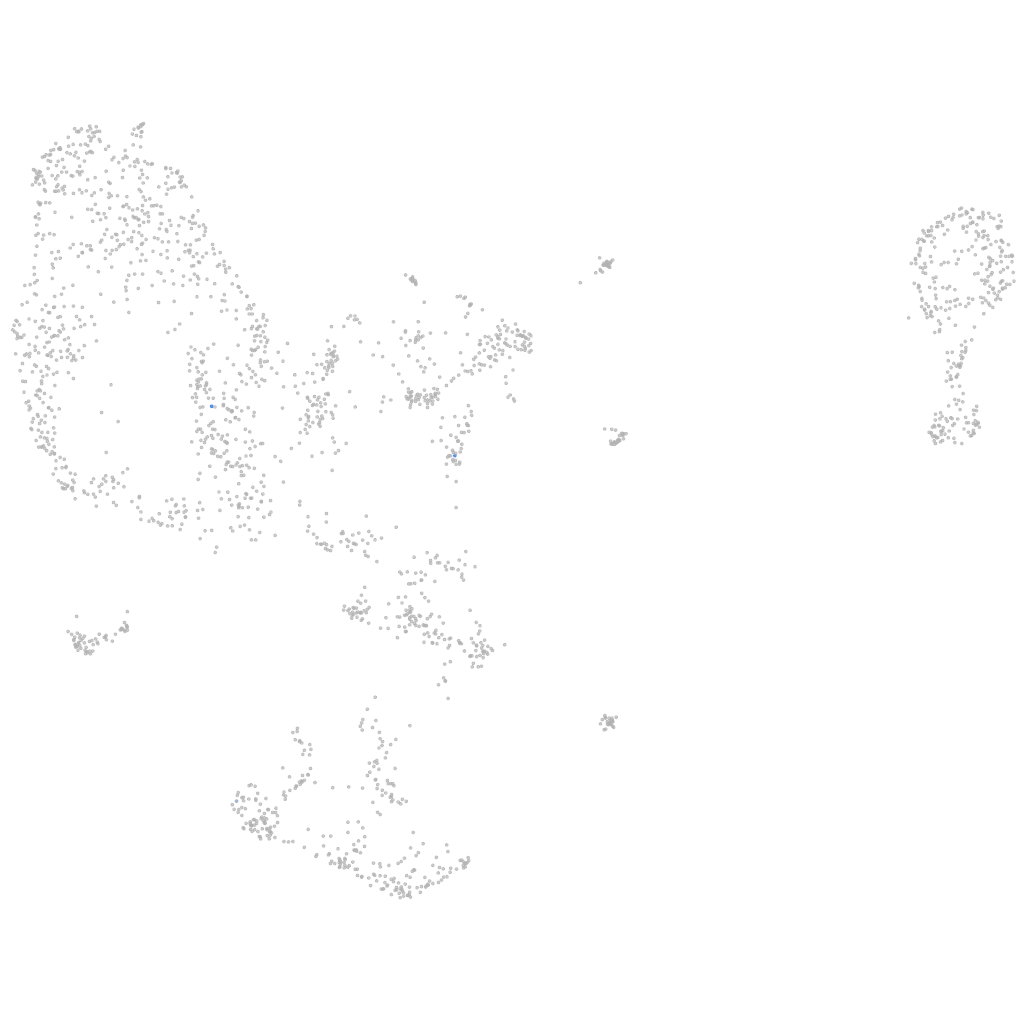
LOC100148023 (pronephros)
Gene expression UMAP
Display:
Expression
Stage
Other cell groups
all cells
blastomeres
PGCs
endoderm
axial mesoderm
muscle
mural cells /
non-skeletal muscle
mesenchyme
hematopoietic /
vasculature
pronephros
neural
spinal cord / glia
eye
taste / olfactory
otic / lateral line
epidermis
periderm
fin
ionocytes / mucous
pigment cells
Expression by stage/cluster
Correlated gene expression
Positive correlation
Negative correlation
Gene
r
Gene
r
si:ch211-276a23.5
0.682
cd164
-0.029
CT737184.2
0.678
sdhc
-0.029
LOC110438489
0.678
pgk1
-0.028
grin3bb
0.599
sat1a.2
-0.027
si:dkey-108k21.11
0.577
h1f0
-0.027
LOC110438160
0.488
rps27l
-0.026
XLOC-029130
0.469
slc16a1b
-0.026
XLOC-029420
0.403
esd
-0.026
LOC103908896
0.392
ier3ip1
-0.025
tbx4
0.369
qkia
-0.025
LOC108179079
0.317
rnf185
-0.025
XLOC-030409
0.313
chmp5b
-0.025
SLC6A13
0.310
pcbd1
-0.025
LOC108189376
0.305
ifi30
-0.024
vsx2
0.294
cebpd
-0.024
BX511025.1
0.274
zgc:103678
-0.024
PRLHR
0.274
mrps26
-0.024
XLOC-033063
0.274
tpm2
-0.024
CR385035.1
0.274
mt-nd4l
-0.023
XLOC-026746
0.274
eif4ebp3l
-0.023
AL954134.1
0.272
ncln
-0.023
prrt4
0.267
ciapin1
-0.023
XLOC-012652
0.250
tcima
-0.023
BX248118.1
0.250
glo1
-0.023
znf1027
0.246
timm8b
-0.023
rx1
0.230
metap2b
-0.023
LOC103909615
0.224
sf3b2
-0.022
myhc4
0.223
col4a5
-0.022
tbx5a
0.223
rtf1
-0.022
LOC108183319
0.219
zgc:56106
-0.022
pde4ca
0.215
cth
-0.022
gig2j
0.208
scpep1
-0.022
hes2.2
0.208
agxtb
-0.022
LOC108182487
0.207
si:ch211-217k17.7
-0.022
CU550719.1
0.202
dpp7
-0.021