Daniocell
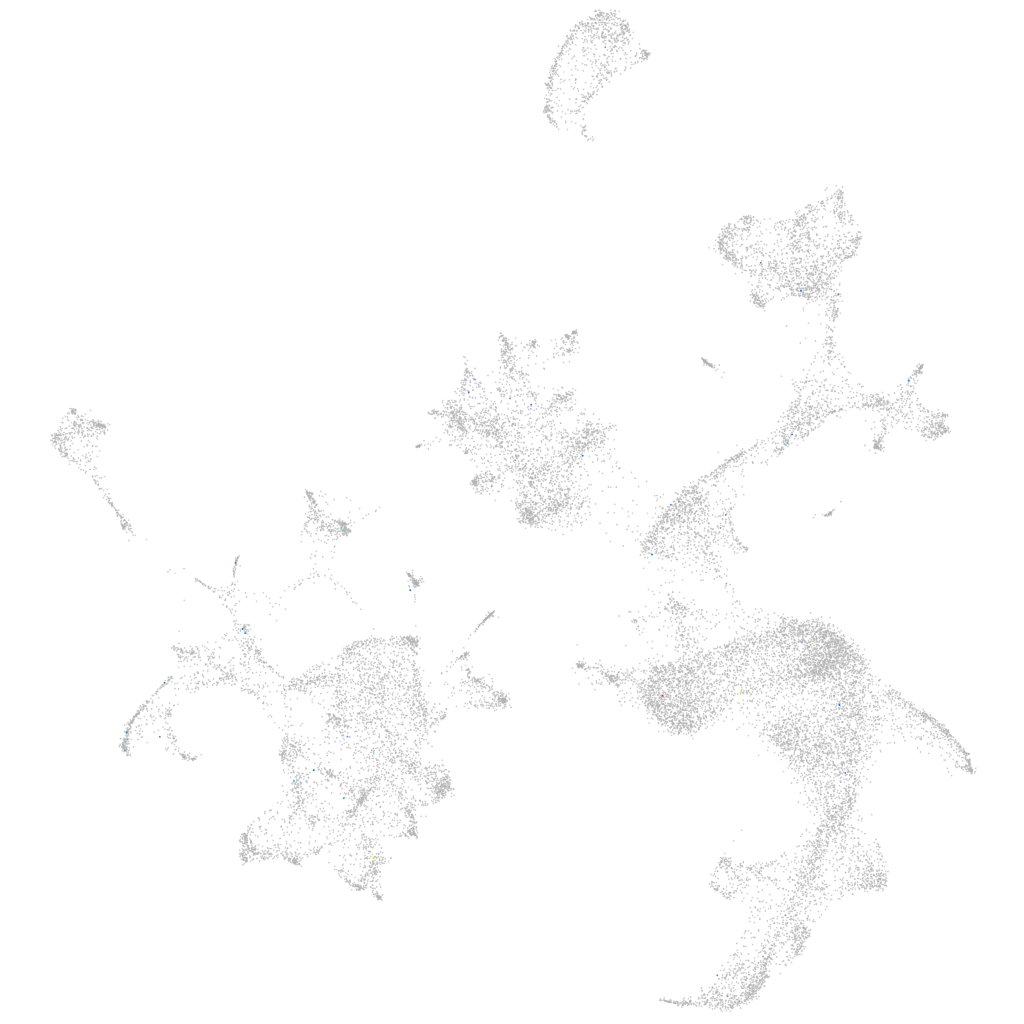
LOC100148023 (hematopoietic / vasculature)
Gene expression UMAP
Display:
Expression
Stage
Other cell groups
all cells
blastomeres
PGCs
endoderm
axial mesoderm
muscle
mural cells /
non-skeletal muscle
mesenchyme
hematopoietic /
vasculature
pronephros
neural
spinal cord / glia
eye
taste / olfactory
otic / lateral line
epidermis
periderm
fin
ionocytes / mucous
pigment cells
Expression by stage/cluster
Correlated gene expression
Positive correlation
Negative correlation
Gene
r
Gene
r
ahsg2
0.367
gabarapa
-0.018
si:dkey-79d12.6
0.205
nt5c2l1
-0.014
BX649434.3
0.200
hbbe1.1
-0.013
cp
0.151
si:dkey-240n22.3
-0.013
slc25a15a
0.141
si:ch211-227m13.1
-0.012
pnp6
0.124
eef2l2
-0.012
wfs1b
0.118
zgc:92606
-0.011
CABZ01086835.1
0.111
XLOC-043857
-0.011
XLOC-041672
0.110
prdx2
-0.011
XLOC-043355
0.109
bloc1s6
-0.011
pimr90
0.108
tbcelb
-0.011
nlgn2a
0.108
zfp36l2
-0.011
mtx1a
0.105
alas2
-0.011
evpla
0.097
myhz2
-0.011
otomp
0.097
nupr1a
-0.011
sult4a1
0.096
ndufa2
-0.011
slc44a4
0.096
ddx6
-0.010
myom1b
0.089
hbae5
-0.010
si:dkey-179k24.1
0.089
apoa1b
-0.010
cav3
0.088
LOC100535225
-0.010
tmem179b
0.088
ndrg2
-0.010
CT737190.2
0.088
hemgn
-0.010
XLOC-017060
0.088
h1fx
-0.010
si:dkey-183p4.10
0.086
tp53inp1
-0.010
ajap1
0.084
litaf
-0.010
si:dkey-17e16.15
0.083
gpx4a
-0.009
slmapb
0.081
hbae1.3
-0.009
CR352226.5
0.078
tspo
-0.009
jmjd7
0.078
fzd4
-0.009
XLOC-002540
0.077
nr2f2
-0.009
nfat5a
0.075
dedd1
-0.009
CR749752.1
0.074
faxdc2
-0.009
si:ch211-240l19.5
0.073
acta1b
-0.009
CABZ01046949.1
0.072
gapdh
-0.009
rwdd2b
0.072
tmem256
-0.009