Daniocell
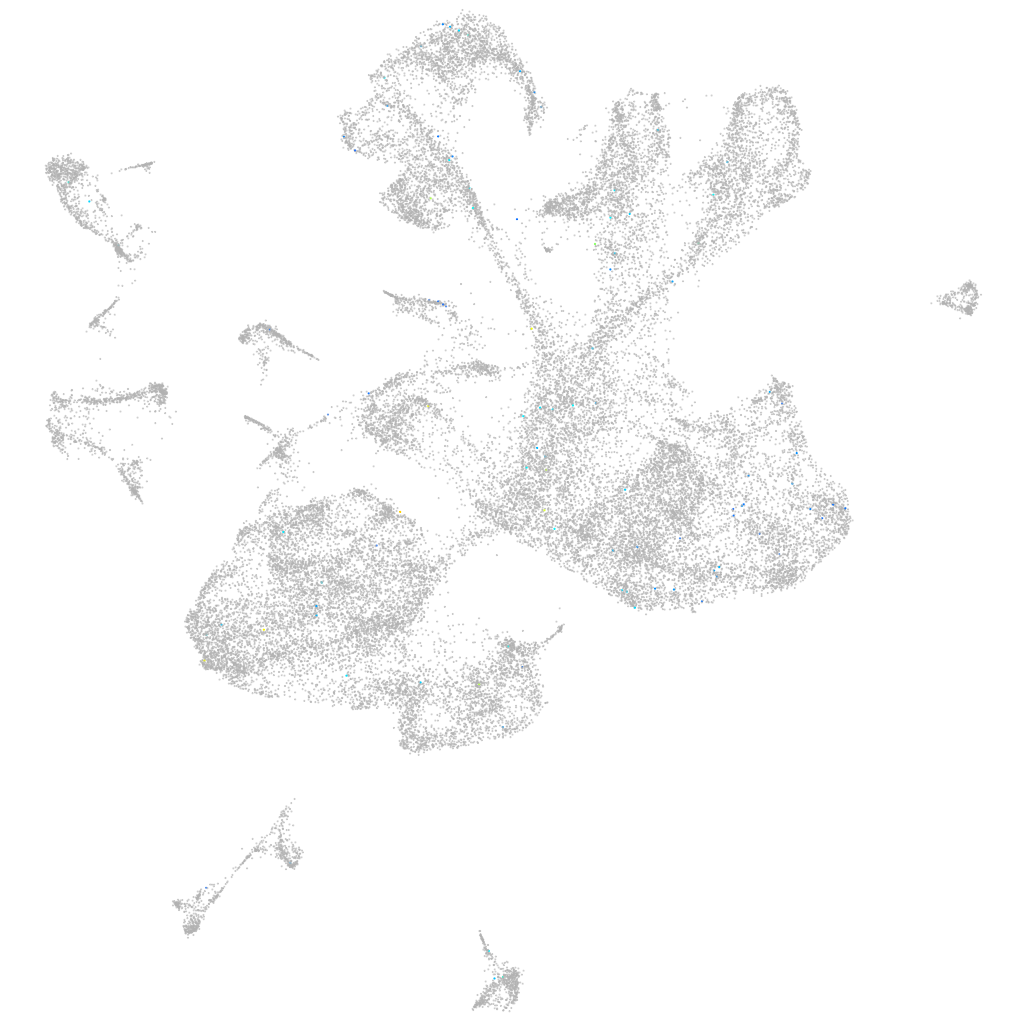
LOC100148023 (glial cells / spinal cord)
Gene expression UMAP
Display:
Expression
Stage
Other cell groups
all cells
blastomeres
PGCs
endoderm
axial mesoderm
muscle
mural cells /
non-skeletal muscle
mesenchyme
hematopoietic /
vasculature
pronephros
neural
spinal cord / glia
eye
taste / olfactory
otic / lateral line
epidermis
periderm
fin
ionocytes / mucous
pigment cells
Expression by stage/cluster
Correlated gene expression
Positive correlation
Negative correlation
Gene
r
Gene
r
CR925755.2
0.128
nucks1b
-0.012
slc22a13a
0.092
atg12
-0.012
XLOC-021180
0.084
shha
-0.012
zgc:162611
0.079
ncalda
-0.012
XLOC-000598
0.077
gpc4
-0.012
si:dkey-27d5.3
0.075
fuca1.2
-0.012
si:ch211-57b15.2
0.068
pdia3
-0.012
XLOC-012846
0.065
tmem131
-0.012
LOC101885924
0.065
tmem97
-0.011
btr20
0.063
ntn1b
-0.011
XLOC-043762
0.062
nufip2
-0.011
XLOC-003082
0.060
CR751602.2
-0.011
or106-11
0.052
spon1b
-0.011
XLOC-014851
0.052
ncam1b
-0.011
XLOC-035742
0.052
rest
-0.011
plekhg6
0.051
cpox
-0.011
adgre10
0.051
ccnjl
-0.011
si:rp71-1i20.2
0.051
plp1a
-0.011
lrriq3
0.049
ptn
-0.011
LOC110437829
0.048
supt4h1
-0.011
CR354564.2
0.048
rae1
-0.011
LOC103910643
0.047
metrnla
-0.010
CR394528.1
0.047
ctcf
-0.010
XLOC-044316
0.046
amotl2a
-0.010
slc2a6
0.045
tob1b
-0.010
LOC101886911
0.044
fgfr3
-0.010
si:ch73-166o21.1
0.044
cd82a
-0.010
gata6
0.043
tspan9b
-0.010
ceacam1
0.043
sulf1
-0.010
LOC101885283
0.043
hexa
-0.010
LOC101884973
0.042
anxa11a
-0.010
si:dkey-46i9.6
0.041
col2a1a
-0.010
CT573263.1
0.041
col8a1a
-0.010
si:ch73-206d17.1
0.040
mau2
-0.010
BX901883.1
0.040
pkp3b
-0.010