Daniocell
arhgap33 (periderm)
Rho GTPase activating protein 33
ZFIN
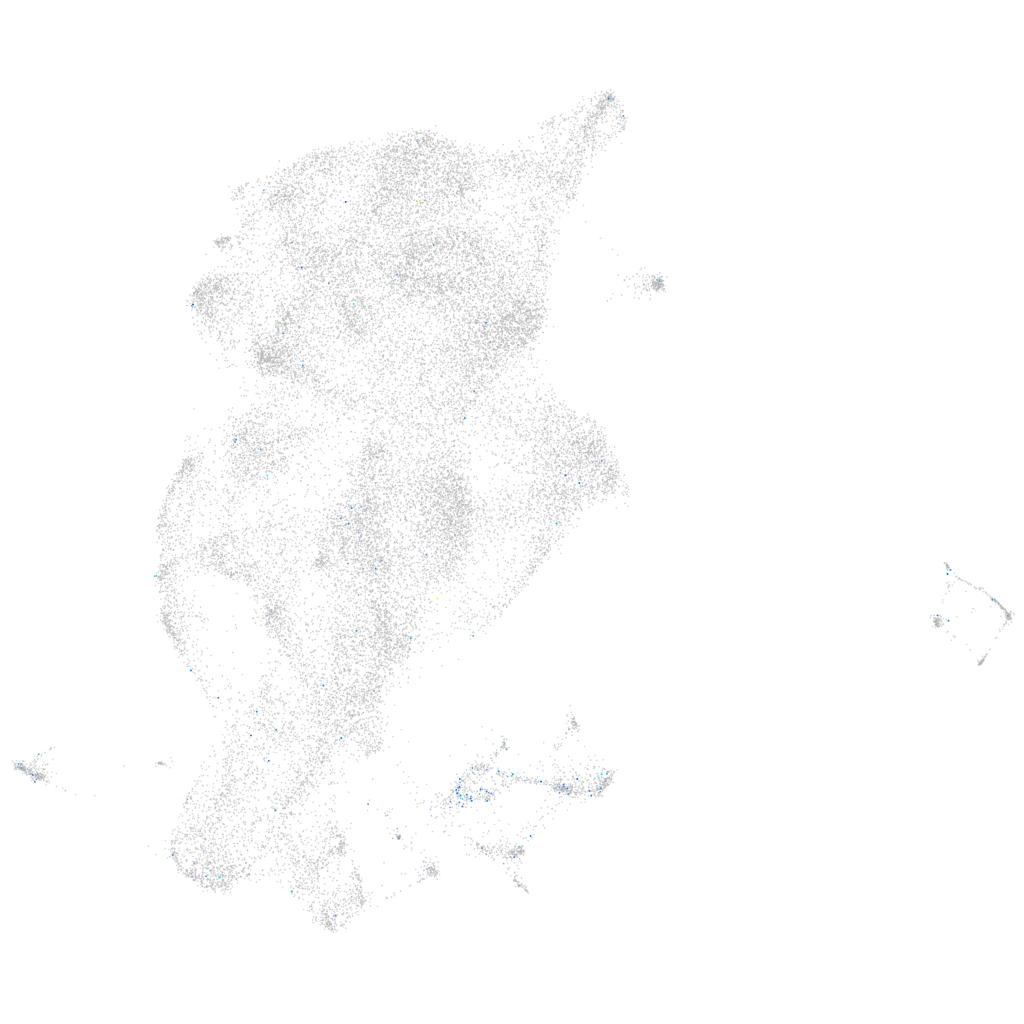
Gene expression UMAP
Display:
Expression
Stage
Other cell groups
all cells
blastomeres
PGCs
endoderm
axial mesoderm
muscle
mural cells /
non-skeletal muscle
mesenchyme
hematopoietic /
vasculature
pronephros
neural
spinal cord / glia
eye
taste / olfactory
otic / lateral line
epidermis
periderm
fin
ionocytes / mucous
pigment cells
Expression by stage/cluster
Correlated gene expression
Positive correlation
Negative correlation
Gene
r
Gene
r
CT956066.1
0.189
cyt1
-0.051
BX470154.1
0.171
wu:fb18f06
-0.044
glra4b
0.140
krt4
-0.043
slc7a10b
0.134
si:ch211-195b11.3
-0.042
arhgef40
0.133
zgc:193505
-0.038
zgc:193593
0.129
icn2
-0.036
CR848791.1
0.128
krt5
-0.034
XLOC-007573
0.121
aldob
-0.033
crhb
0.121
eef1da
-0.033
si:dkey-285e18.2
0.118
cyt1l
-0.032
il2rb
0.118
agr1
-0.031
kcnk3a
0.117
anxa1a
-0.031
crb1
0.113
selenow1
-0.030
si:dkey-211g8.7
0.113
cfl1l
-0.030
si:ch73-359m17.6
0.112
eevs
-0.030
si:dkey-83f18.11
0.111
tcnbb
-0.029
mep1a.2
0.111
ckap4
-0.028
ghrhrb
0.109
pycard
-0.028
f7
0.108
si:ch73-52f15.5
-0.028
SGCZ
0.106
slc38a5b
-0.027
ctbs
0.103
si:dkey-247k7.2
-0.026
CU041363.1
0.103
zgc:162730
-0.026
CR354556.1
0.103
abcb5
-0.026
CABZ01086877.1
0.101
eif4ebp3
-0.026
slc32a1
0.101
anxa1c
-0.025
XLOC-025566
0.100
icn
-0.025
pcdh2ab5
0.100
krt17
-0.025
dlgap1b
0.099
rplp2
-0.025
he1.1.1
0.099
si:ch211-207n23.2
-0.024
ifit8
0.099
cdc34a
-0.024
si:ch211-270g19.5
0.099
si:ch211-105c13.3
-0.024
si:dkey-28d5.14
0.094
scel
-0.024
LOC101885638
0.094
krtt1c19e
-0.024
hmgb1b
0.094
tdh
-0.023
hoxa1a
0.093
si:dkey-184p9.7
-0.023